ChartDrawItem Event
Upon selecting a chart type, Chart™ creates the appropriate layers and graphic objects that comprise the primitives of a chart. Once primitives are created, they are drawn on to the Scene Graph, an internal collection object that stores and manages these graphic objects. The color model and other properties allows us to change various aspects of chart items, but sometimes fall short of allowing complete control easily. For these purposes we will implement an event that is fired just before a primitive is sent to the graphics renderer.
ChartDrawItemEventArgs has the following parameters:
-
Primitive – Infragistics.UltraChart.Core.Primitive
-
HasData – Boolean, indicates if the primitive associates with the data value. For example, the chart title text has nothing to do with data that is drawn. On the other hand, the column (box) that is drawn in case of Column chart contains data that represents the data value.
An application can modify all the values of the primitive, except for visual properties which do not come under the rendering pipeline to effect the change. The following are items of interest for a developer and has sure effect on how the primitive is drawn.
-
ChartDrawItemEventArgs.Primitive – Instance of primitive. When assigned to null it will not be rendered on chart image.
-
ChartDrawItemEventArgs.Primitive.PE – Indicates the look and feel, coloring/texturing and other related items of paint element for the primitive objects. In the chart, normally one instance of the paint element is shared amongst more than one primitive, and thus change in one instance will affect the other that follow. As a rule of thumb, it is better to assign another instance of paint element when changing the looks of the control.
-
ChartDrawItemEventsArgs.Primitive.Visible – Used to set visibility of the paint element.
-
ChartDrawItemEventArgs.HasData – Used in conditional IF statement, to check if the primitive drawn is associated with the data.
|
Note
|
Note
This topic assumes that you already created a chart. For information on how to create a chart, see Adding Chart to a Form
|
At design time, you can find server-side events in the Events section of the property window.
The following code demonstrates how to handle the ChartDrawItem event.
' Assign handler
Me.ultraChart1.ChartDrawItem +=
new ChartDrawItemEventHandler(Me.UltraChart1_ChartDrawItem)
'ChartDrawItem Event Code
Private Sub UltraChart1_ChartDrawItem(ByVal sender As Object, _
  ByVal e As Infragistics.UltraChart.Shared.Events.ChartDrawItemEventArgs) _
  Handles UltraChart1.ChartDrawItem
     If e.HasData Then
        Console.WriteLine(e.Primitive.ToString())
	Console.WriteLine(e.Primitive.Layer)
	If TypeOf e.Primitive Is Box Then
	   e.Primitive.PE.ElementType = PaintElementType.Gradient
	   e.Primitive.PE.Fill = Color.Red
	   e.Primitive.PE.FillStopColor = Color.Yellow
	   e.Primitive.PE.FillGradientStyle = GradientStyle.ForwardDiagonal
	   CType(e.Primitive, Box).Roundness = 10
	End If
     End If
End Sub
// Assign handler
this.ultraChart1.ChartDrawItem +=
new ChartDrawItemEventHandler(this.UltraChart1_ChartDrawItem);
// ChartDrawItem Event Code
private void UltraChart1_ChartDrawItem(object sender, ChartDrawItemEventArgs e)
{
   if (e.HasData)
   {
      Console.WriteLine(e.Primitive.ToString());
      Console.WriteLine(e.Primitive.Layer);
      if (e.Primitive is Box)
      {
         e.Primitive.PE.ElementType = PaintElementType.Gradient;
	 e.Primitive.PE.Fill = Color.Red;
	 e.Primitive.PE.FillStopColor = Color.Yellow;
	 e.Primitive.PE.FillGradientStyle = GradientStyle.ForwardDiagonal;
	 ((Box)e.Primitive).Roundness = 10;
      }
   }
}
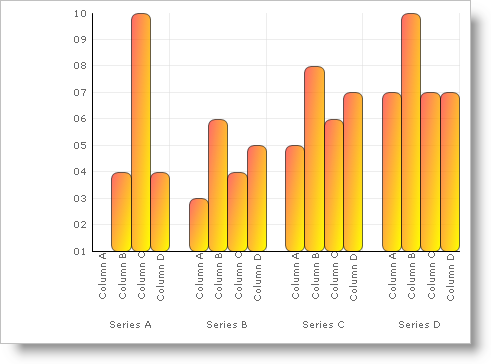
The example code will generate the following chart: