
In charts with both an x- and y-axis, the square area adjacent to where these axes meet is known as the "chart grid". Starting in 2006 Volume 3, in both composite and non-composite charts, a PaintElement object is provided to customize the appearance of this area. The following properties are available:
Axis.PE — non-composite charts
ChartArea.GridPE — composite charts
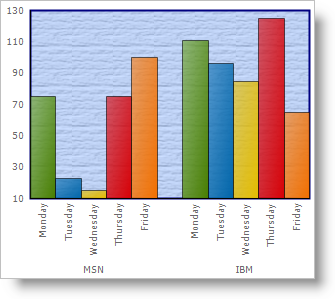
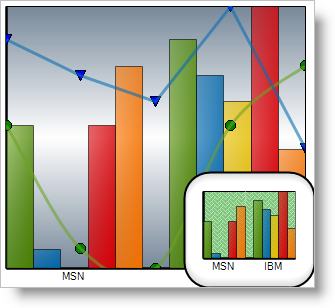
Below are example screenshots below of a non-composite chart (left) and a composite chart (right) with the background PaintElment customized.
The example code below demonstrates how to manipulate these PaintElements.
In Visual Basic:
Imports Infragistics.UltraChart.Shared.Styles
...
' for non-composite chart
Me.ultraChart1.Axis.PE.ElementType = PaintElementType.Texture
Me.ultraChart1.Axis.PE.Fill = Color.CornflowerBlue
Me.ultraChart1.Axis.PE.FillOpacity = 100
Me.ultraChart1.Axis.PE.Stroke = System.Drawing.Color.Navy
Me.ultraChart1.Axis.PE.StrokeWidth = 2
Me.ultraChart1.Axis.PE.Texture = TexturePresets.Canvas
' for composite chart
Me.ultraChart1.CompositeChart.ChartAreas(0).GridPE.ElementType = _
  PaintElementType.Gradient
Me.ultraChart1.CompositeChart.ChartAreas(0).GridPE.Fill = _
  Color.LightSlateGray
Me.ultraChart1.CompositeChart.ChartAreas(0).GridPE.FillGradientStyle = _
  GradientStyle.VerticalBump
Me.ultraChart1.CompositeChart.ChartAreas(0).GridPE.FillStopColor = _
  Color.White
Me.ultraChart1.CompositeChart.ChartAreas(1).GridPE.ElementType = _
  PaintElementType.Hatch
Me.ultraChart1.CompositeChart.ChartAreas(1).GridPE.Fill = _
  Color.PaleGreen
Me.ultraChart1.CompositeChart.ChartAreas(1).GridPE.FillStopColor = _
  Color.DarkSeaGreen
Me.ultraChart1.CompositeChart.ChartAreas(1).GridPE.Hatch = _
  FillHatchStyle.Weave
In C#:
using Infragistics.UltraChart.Shared.Styles;
...
// for non-composite chart
this.ultraChart1.Axis.PE.ElementType = PaintElementType.Texture;
this.ultraChart1.Axis.PE.Fill = Color.CornflowerBlue;
this.ultraChart1.Axis.PE.FillOpacity = 100;
this.ultraChart1.Axis.PE.Stroke = System.Drawing.Color.Navy;
this.ultraChart1.Axis.PE.StrokeWidth = 2;
this.ultraChart1.Axis.PE.Texture = TexturePresets.Canvas;
// for composite chart
this.ultraChart1.CompositeChart.ChartAreas[0].GridPE.ElementType =
  PaintElementType.Gradient;
this.ultraChart1.CompositeChart.ChartAreas[0].GridPE.Fill =
  Color.LightSlateGray;
this.ultraChart1.CompositeChart.ChartAreas[0].GridPE.FillGradientStyle =
  GradientStyle.VerticalBump;
this.ultraChart1.CompositeChart.ChartAreas[0].GridPE.FillStopColor =
  Color.White;
this.ultraChart1.CompositeChart.ChartAreas[1].GridPE.ElementType =
  PaintElementType.Hatch;
this.ultraChart1.CompositeChart.ChartAreas[1].GridPE.Fill =
  Color.PaleGreen;
this.ultraChart1.CompositeChart.ChartAreas[1].GridPE.FillStopColor =
  Color.DarkSeaGreen;
this.ultraChart1.CompositeChart.ChartAreas[1].GridPE.Hatch =
  FillHatchStyle.Weave;