
At some point during the building of your application using the Chart control, you may have asked the following questions:
How much should the null values stand out?
How distinct should the null values be, compared to the other values?
The UltraChart.Data.EmptyStyle property can be used to customize this aspect of the chart. It provides properties which are used for:
Customizing the way lines are drawn on or around null values:
EmptyStyle.LineStyle
Customizing the way areas are painted when they represent null values:
EmptyStyle.PE
Drawing points at locations where null values are plotted:
EmptyStyle.PointStyle
EmptyStyle.PointPE
Enabling or disabling any of the above features:
EmptyStyle.EnableLineStyle
EmptyStyle.EnablePE
EmptyStyle.EnablePoint
This will be done through a few visual examples.
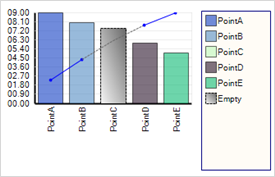
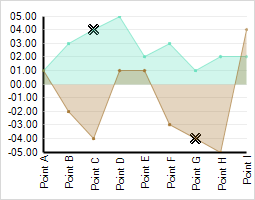
Starting with a InterpolateSimple line chart, the Data.EmptyStyle.EnablePoint property is set to True.
The result is that a symbol is drawn to indicate which values are null on the chart. By default, this symbol is an "X". The symbol can be customized using the EmptyStyle.PointStyle and EmptyStyle.PointPE properties.
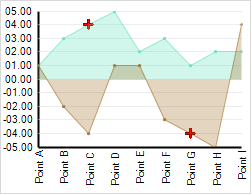
Tip: to access a wide variety of symbols, try setting the PointStyle.Icon property to Character and the CharacterFont property to the Wingdings font.
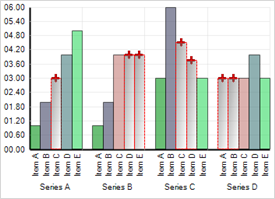
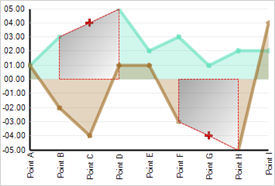
To demonstrate some customization, the PointStyle.Icon property is set to Plus, the PointPE.Stroke property is set to DarkRed, and the PointPE.Fill property is set to Red.
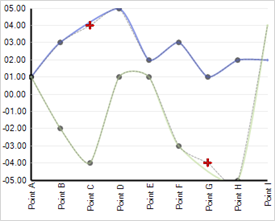
Now, the EnableLineStyle property is set to True. By default, the LineStyle property provides a dashed line. For clarity, the AreaChart.LineThickness property is set to 5 for this image:
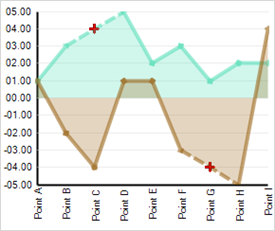
The result is a dashed line across the points which are null.
Finally, the EnablePE property is set to True, and the PE property is configured to use a ForwardDiagonal gradient from DimGray to WhiteSmoke with decreasing opacity, and Red Stroke. This will affect the painted portion of the area chart around the null value:
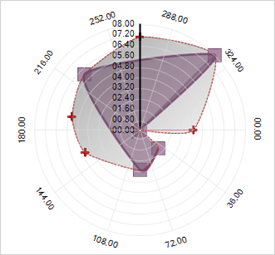
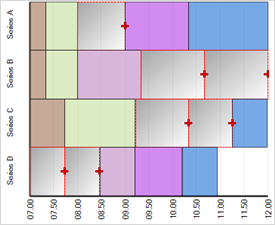
Because each chart type displays data in a different way, null handling and empty styles vary for each chart type. Following are a few visual examples:
Some chart types, such as Gantt and candle charts, do not have any null handling enabled. 3D charts have limited null handling, with no interpolation feature or empty style.
For a representation of empty values in the chart legend, set the EmptyStyle.ShowInLegend property to True. The EmptyStyle.Text property can also be set to determine how this legend entry is labeled.