
This topic shows you how to add/remove primitives to/from the chart before the chart is rendered using the FillSceneGraph event. Using this event eliminates the need to create a custom layer class.
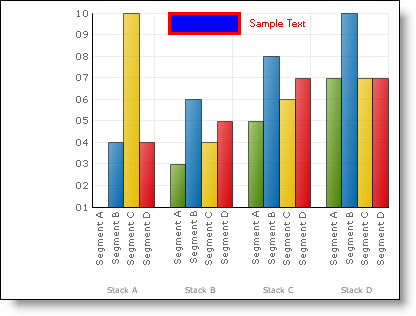
When you save and run your application after completing the following steps, your chart should look similar to the following image:
To modify the scene graph using FillSceneGraph event:
Before you start writing any code, you should place using/Imports directives in your code-behind so you don’t need to always type out a member’s fully qualified name.
In Visual Basic:
Imports Infragistics.UltraChart.Core.ColorModel
Imports Infragistics.UltraChart.Core.Util
Imports Infragistics.UltraChart.Core.Layers
Imports Infragistics.UltraChart.Core.Primitives
Imports Infragistics.UltraChart.Data
Imports Infragistics.UltraChart.Resources
Imports Infragistics.UltraChart.Resources.Appearance
Imports Infragistics.UltraChart.Resources.Editor
Imports Infragistics.UltraChart.Shared.Styles
In C#:
using Infragistics.UltraChart.Core;
using Infragistics.UltraChart.Core.ColorModel;
using Infragistics.UltraChart.Core.Util;
using Infragistics.UltraChart.Core.Layers;
using Infragistics.UltraChart.Core.Primitives;
using Infragistics.UltraChart.Data;
using Infragistics.UltraChart.Resources;
using Infragistics.UltraChart.Resources.Appearance;
using Infragistics.UltraChart.Resources.Editor;
using Infragistics.UltraChart.Shared.Styles;
Create the FillSceneGraph event.
In Visual Basic:
Private Sub UltraChart1_FillSceneGraph(ByVal sender As System.Object, _
  ByVal e As Infragistics.UltraChart.Shared.Events.FillSceneGraphEventArgs) _
  Handles UltraChart1.FillSceneGraph
In C#:
private void ultraChart1_FillSceneGraph(object sender,
  Infragistics.UltraChart.Shared.Events.FillSceneGraphEventArgs e)
Get the x and y axes values, as you will need them for mapping functionality.
In Visual Basic:
Dim xAxis As IAdvanceAxis = CType(e.Grid("X"), IAdvanceAxis)
Dim yAxis As IAdvanceAxis = CType(e.Grid("Y"), IAdvanceAxis)
In C#:
IAdvanceAxis xAxis = (IAdvanceAxis)e.Grid["X"];
IAdvanceAxis yAxis = (IAdvanceAxis)e.Grid["Y"];
Make sure that axes values were actually retrieved. This needs to be done because by design the chart will fire the FillSceneGraph event twice. The first time is in early pre-rendering, and the second time is before it actually renders. The first time there is not enough information available to the chart to make the above code actually have values in it, so if you went to use those values in pre-render firing of the event you would get exceptions.
In Visual Basic:
If xAxis Is Nothing Or yAxis Is Nothing Then
	Return
End If
In C#:
if (xAxis == null || yAxis == null)
	return;
In Visual Basic:
Dim [text] As New [Text]()
[text].PE.Fill = Color.Red
[text].bounds = New Rectangle(CInt(xAxis.Map(8)), CInt(yAxis.Map(10)), 100, 20)
[text].SetTextString("Sample Text")
In C#:
Text text = new Text();
text.PE.Fill = Color.Red;
text.bounds = new Rectangle((int)xAxis.Map(8), (int)yAxis.Map(10), 100, 20);
text.SetTextString("Sample Text");
Add the text Primitive to the SceneGraph.
In Visual Basic:
e.SceneGraph.Add([text])
In C#:
e.SceneGraph.Add(text);
Create a Box Primitive and set the following values:
Color — Blue
Stroke Color — Red
Stroke Width — 3
Row — 0
Column — 0
Layer — GetChartLayer()
Chart — ChartType
Value — 42
Caps — PCaps.HitTest | PCaps.Tooltip
In Visual Basic:
Dim box As New Box(New Rectangle( _
  CInt(xAxis.Map(5)), CInt(yAxis.Map(10)), 70, 20))
box.PE.Fill = Color.Blue
box.PE.Stroke = Color.Red
box.PE.StrokeWidth = 3
box.Row = 0
box.Column = 0
box.Layer = e.ChartCore.GetChartLayer()
box.Chart = Me.UltraChart1.ChartType
box.Value = 42
box.Caps = PCaps.HitTest Or PCaps.Tooltip
In C#:
Box box = new Box(new Rectangle(
  (int)xAxis.Map(5), (int)yAxis.Map(10), 70, 20));
box.PE.Fill = Color.Blue;
box.PE.Stroke = Color.Red;
box.PE.StrokeWidth = 3;
box.Row = 0;
box.Column = 0;
box.Layer = e.ChartCore.GetChartLayer();
box.Chart = this.ultraChart1.ChartType;
box.Value = 42;
box.Caps = PCaps.HitTest | PCaps.Tooltip;
Add the Box Primitive to the SceneGraph.
In Visual Basic:
e.SceneGraph.Add(box)
In C#:
e.SceneGraph.Add(box);
Save and run your application.