WebChart Smart Tag
In Visual Studio 2005 (.NET Framework 2.0), each Ultimate UI for ASP.NET control/component is equipped with a Smart Tag. By simply selecting the control/component, a Smart Tag anchor appears. When you click this anchor, a pop-up panel appears, providing you with quick and easy access to the most common properties and settings of the control/component.
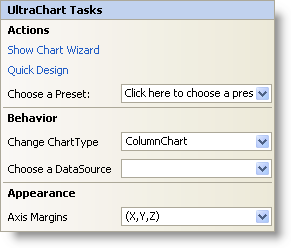
The WebChart™ Smart Tag contains the following sections:
-
Actions — Provides quick access to the Chart Wizard and Quick Design, which allow you to create and configure charts.
-
Behavior — Provides easy access to properties that govern how the control behaves on the form.
-
Appearance — Provides common tasks involving the appearance, look, and feel of the control.
See below for a description of the item (e.g., drop-down list) in each section, as well as the item’s corresponding property in the properties grid.
| Actions |
Description |
Corresponding Property |
|
Clicking this will display the Chart Wizard. You can also open the Chart Wizard by right-clicking the WebChart control and selecting Chart Wizard.
|
|
|
Click Quick Design to access WebChart’s Quick Design. You can also access it by right-clicking the WebChart control and selecting Quick Design from the pop-up menu.
|
|
|
Use the drop-down list to quickly select a preset for the WebChart. This is the same functionality as if you opened the Quick Designer, expanded Presets, and clicked on Manage Presets.
|
|
| Behavior |
Description |
Corresponding Property |
|
Click the drop-down arrow and you will be presented with a graphical representation of the many chart types available to you.
|
|
|
The drop-down list enables you to select which data source you want the WebChart to use. If you do not have a data source configured, select <New data source…>.
|
|
| Appearance |
Description |
Corresponding Property |
|
Click the drop-down arrow and a representation of the x- and y-axes will appear. Drag whichever axis for which you want to change the margin.
|
|