Reveal allows you to export the data used for your dashboards to the Excel format. Data for every visualization in your dashboard will be on a separate sheet in the excel file.
To export a dashboard as an Excel spreadsheet, go to Dashboard View mode and select: the overflow menu ⇒ Export ⇒ Excel. The following dialog will open:
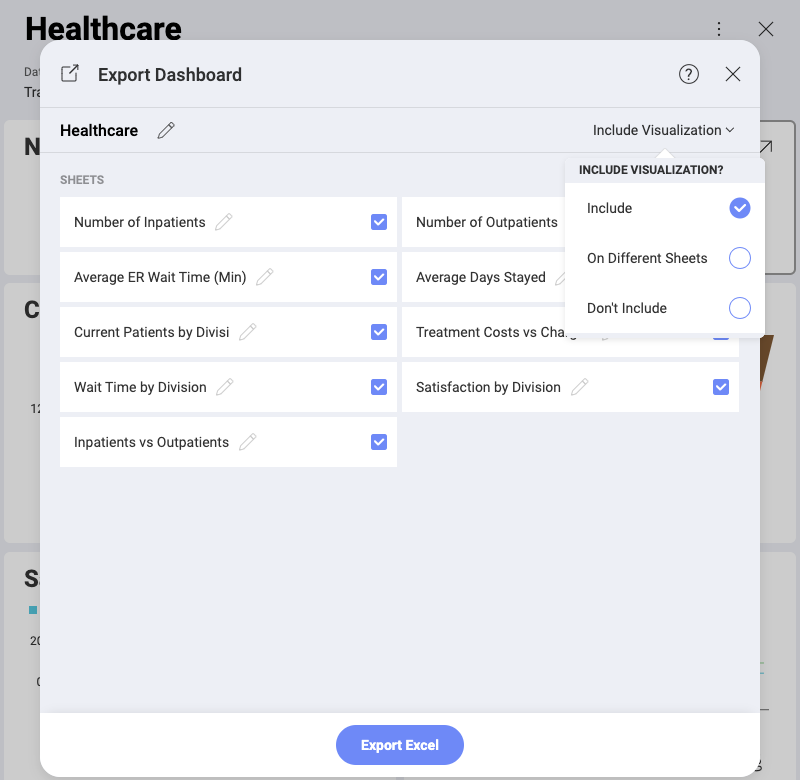
This Export Dashboard dialog allows you to select and rename the data sheets to be included in your Excel file. Every data sheet contains the data for a particular visualization in the dashboard you export. You can also include the visualizations in your Excel document.
The Include Visualization setting gives you the following options:
Include - include a dashboard’s visualizations on the same sheet as the data for this visualization;
On Different Sheets - include visualizations and their corresponding data on separate sheets;
Don’t Include - include only the visualizations' data in the Excel sheets.