Google Analytics is one of the most used web analytics services in the web, it tracks and reports website traffic. In addition, Google also provides an SDK to gather usage data from iOS and Android apps.
Log in
Select Google Analytics as your data source and you will see Google’s login screen.
Enter your login credentials and tap "Sign In". You will then see an authorization prompt; tap "Allow".
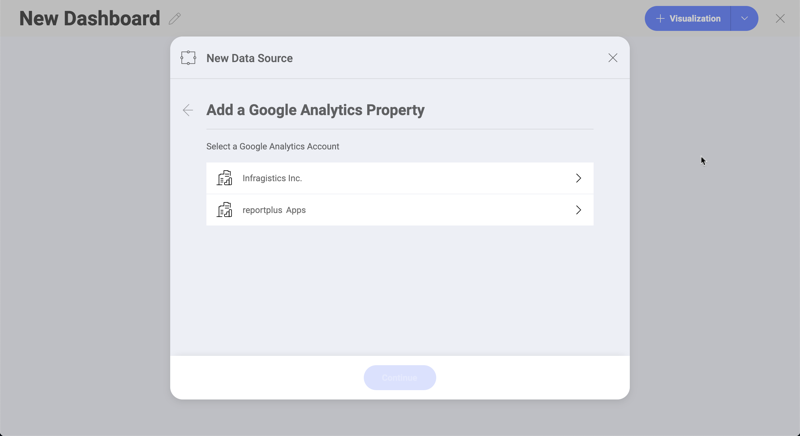
Choose an account
If you have several Google Analytics accounts, select the one you want to use.
Once logged in, you can also use the same account later to create another visualization unless you delete the data source.
Choose a Property
Select the Google Analytics property that you want to use.
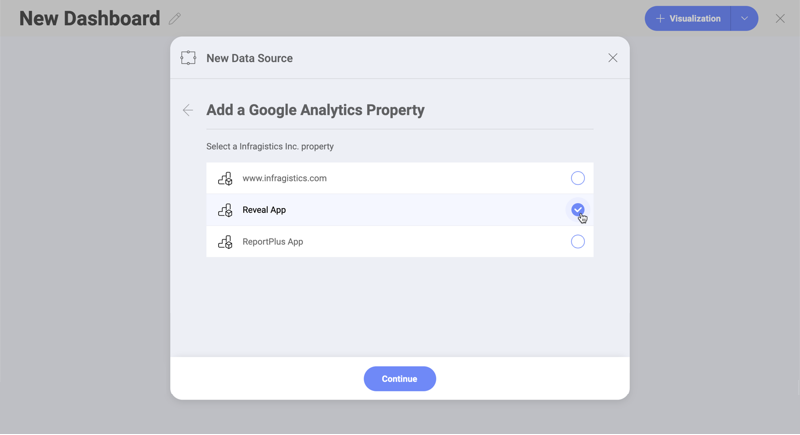
In Google Analytics, properties can be websites, mobile apps, blogs, among others.
Choose a database cube
Select the data cube that you want to use.
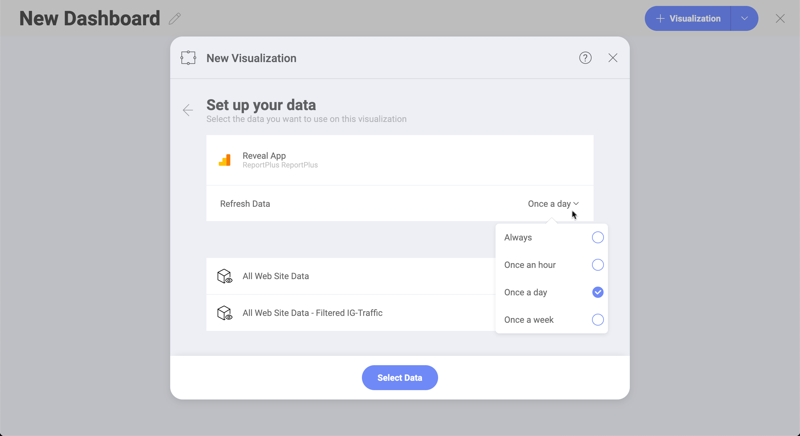
In this dialog you can configure the Refresh Data setting to to the following values:
Always
Once an hour
Once a day
Once a week
After your credentials are verified, Reveal will take you to the Visualizations Editor showing Dimensions and Measures.
A data cube is used to store and represent multidimensional data. Unlike two-dimensional data models, where two dimensions are used (arranged in row and column format) to view, analyze and calculate data, a data cube has three or more dimensions.
The concept of a data cube is used to represent the dimensions of data available to a user. For example, "sales" could be measured in the dimensions of product category, geography, date, customers, etc. In this case, "sales" is the measure attribute of the data cube.
When you create a dashboard with information coming from Google Analytics, you will see fields organized differently as seen in the screenshot below.
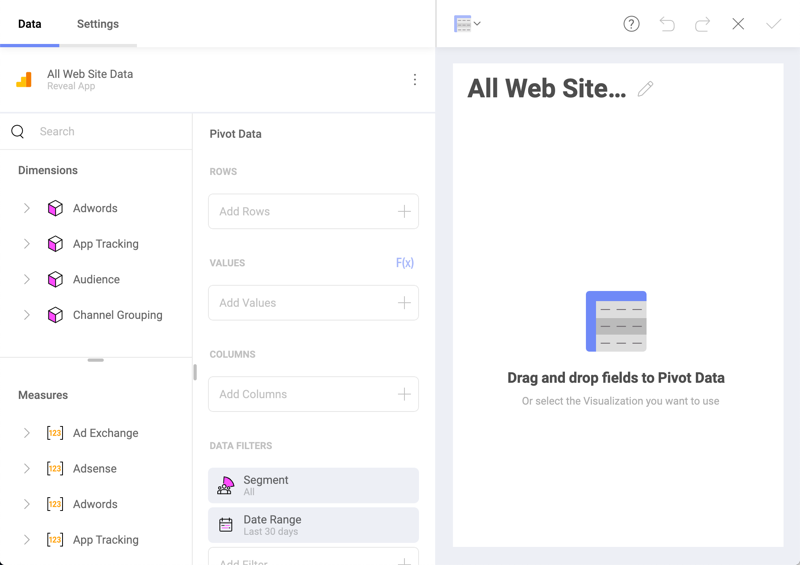
As you can see, there is no "Fields" heading. In its place, there are two sections in their own query field:
Dimensions (depicted by a cube icon with a pink side): Dimensions are structures used to categorize data that can be measured. Elements in a dimension are organized in attributes. Attributes are elements with single level hierarchies (e.g. a "Demographic" attribute, containing groups of elements like "Gender", "Marital Status", etc.)
Measures (depicted by [123] icon): Measures consist of numeric data.
The default visualization type for the Google Analytics data source is a Pivot table. For Rows and Columns you must use Dimensions data, for Values you use Measures data.
For more information on dimensions and measures, please visit this Technet article.
You can use Goals defined in Google Analytics in the Visualization Editor. Your Goals are listed as part of the metrics in both Dimensions and Measures data types.
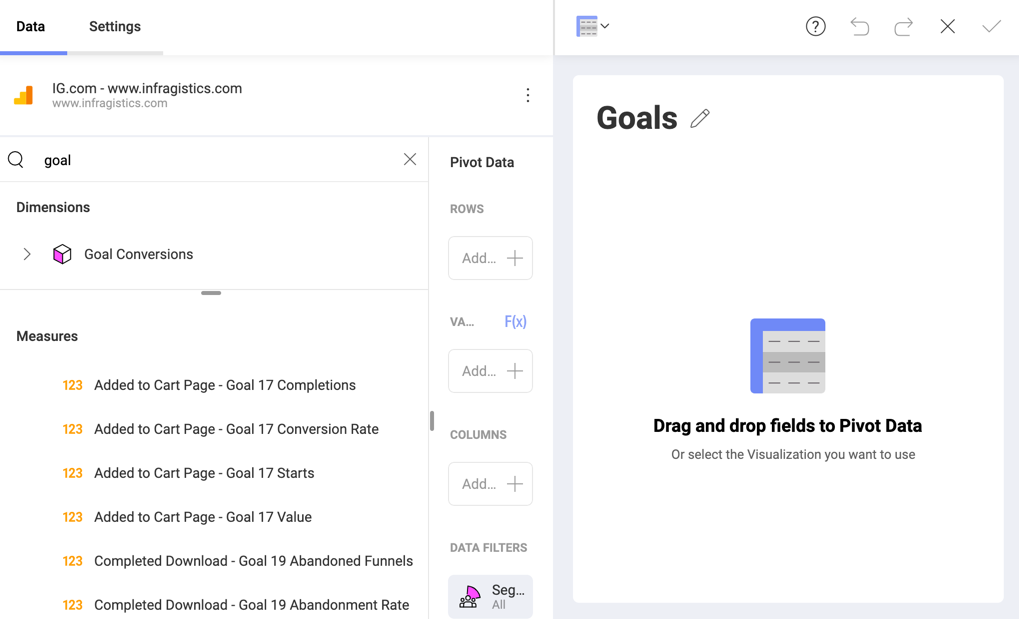
As you can see in the example above, the titles of your Google Analytics Goals in Reveal include one or more of the following:
a numeric ID, from 1 to 20.
a label at the beginning - this is the name of the goal you configured for the specific goal, e.g. Completed Download for Goal 19.
a goal type at the end - e.g. Completions, Abandoned Funnels, etc.
For more information about Goals, please refer to this Google Analytics help page.