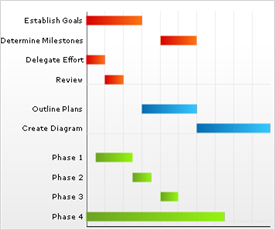
A gantt chart shows "floating" bars, each of which portray defined start and end times. Gantt charts are most often used in project management, where each bar represents a different task to be accomplished.
This architecture allows the application developer to extend the chart easily and with maximum flexibility. The Chart layers framework allows an application developer to slide a custom layer in the existing "deck" of layers.
If you want your chart to display data in chronological order, and plot points across the x-axis according to elapsed time, see Display Data on a Time-Scale Axis.