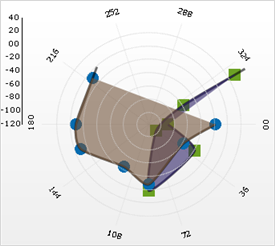
The polar chart is a two-dimensional data representation drawn using linear and radial axes. In the simplest case, it charts a double {angle, radial-distance} representing the distance from the center of the chart and angle of orientation. Other variations are special cases of this intrinsic representation.
For example, points represented by {angle, radial-distance} can be connected to join lines and points connected with line and spline-interpolated for estimating missing values. Another special case allows grouping points together to make the chart show three forms of data: {group, angle, radial-distance}. The data plotted as a group can be plotted as scatter points on the radial axes, or points in the group can be joined together to form a series. These intrinsic characteristics make the polar chart effectively a scatter chart with radial mappings.