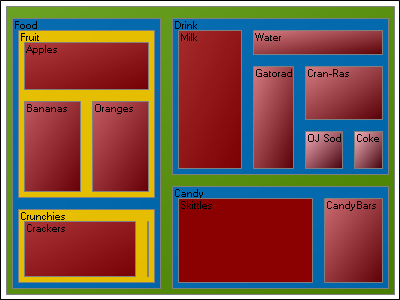

Treemap charts are used to display large hierarchical data sets in a rectangular space. The chart is divided into regions and then each region is divided again for each level of the hierarchy. You can identify the data on a treemap chart by the size and color of the region.
Treemap charts are typically used to visualize the contents of a hard drive with thousands of files in many levels of directories.