Imports Infragistics.UltraChart.Resources.Appearance

This topic explains how chart text labels are applied to graphical 2D chart elements (e.g., bars, columns, pie slices, and midpoint anchors). After reading this topic, you will gain an understanding of how chart text labels are applied to your chart, how they can be styled and aligned, and how they leverage the Chart control’s Label Keyword feature.
To work with chart text, you need to work with a small group of classes. The following is a list the classes, along with descriptions. This information will lay the groundwork for the procedure below.
Chart — The element responsible for displaying the chart. Developers add their chart text to a Collection object, the ChartText property, on Chart to render chart text within the chart grid (that area between axes where the chart is plotted).
ChartTextCollection — This is the class of the ChartText property, and it supports all of the features developers familiar with the .NET Framework have come to expect and enjoy in their collections, including implementations of IEnumerable, ICollection and IList.
ChartTextAppearance — These objects actually describe individual chart text labels, and are what developers initialize and then add to the ChartText property to render text within the chart.
The procedure for using chart text involves adding one or more ChartTextAppearance objects (which you’ll learn about momentarily) to the ChartTextCollection that exists on supported ChartAppearance objects. Each ChartType property exposes its ChartAppearance object under a different property name (e.g., column charts expose their ChartAppearance object in the ColumnChart property, pie charts expose their ChartAppearance object in the PieChart property, etc.) The ChartTextCollection is always accessible through the ChartText property on the currently active ChartAppearance.
As a result, each of the code examples below assume a particular chart type is active. This means they will refer to the ChartText property on the appropriate ChartAppearance object. Please remember the code example still applies to the ChartText property on any ChartAppearance object, you just have to change the property name to use the ChartAppearance object for the currently displayed chart type.
Before you start writing any code, you should place using/imports directives in your code-behind so you don’t need to always type out a member’s fully qualified name.
In Visual Basic:
Imports Infragistics.UltraChart.Resources.Appearance
In C#:
using Infragistics.UltraChart.Resources.Appearance;
A ChartTextAppearance object is created to manage the presentation of each text label that can be rendered within the confines of a 2D chart’s grid. The following piece of code demonstrates how to create a ChartTextAppearance object using its default constructor and set the minimal properties necessary to display it.
In Visual Basic:
' Create a new Chart Text Appearance object with
' default values for font, color, alignment, etc.
Dim text As ChartTextAppearance = New ChartTextAppearance()
' Identify which chart element this text applies to
' by its underlying data row and column indices.
text.Row = 0
text.Column = 0
' Give this piece of text something to say.
text.ItemFormatString = "Hello"
' Show it.
text.Visible = True
' Given the chart type is ColumnChart, add it to the
' ChartText collection.
Me.UltraChart1.ColumnChart.ChartText.Add( text)
In C#:
// Create a new Chart Text Appearance object with
// default values for font, color, alignment, etc.
ChartTextAppearance text = new ChartTextAppearance();
// Identify which chart element this text applies to
// by its underlying data row and column indices.
text.Row = 0;
text.Column = 0;
// Give this piece of text something to say.
text.ItemFormatString = "Hello";
// Show it.
text.Visible = true;
// Given the chart type is ColumnChart, add it to the
// ChartText collection.
this.ultraChart1.ColumnChart.ChartText.Add( text);
The Row and Column properties uniquely identify one chart element in the chart which this piece of text is supposed to label. These are zero-based index values. In bar and column charting scenarios, it is sometimes more convenient to think of the columns as the individual items, and the rows as series of items. Whatever the chart type may be, Chart maintains a correspondence between the (row, column) of a piece of data and its representation on the chart. These properties are frequently exposed for the purpose of adorning chart elements throughout the element’s API.
ChartTextAppearance also supports a parameterized constructor for convenience at run-time that accepts initial values for all properties. Further discussion on this constructor will be deferred until later in this topic, when you have gained familiarity with a greater number of this class' properties.
Chart text supports the Fonts and Colors from the .NET Framework’s System.Drawing namespace that many developers are already comfortable with. Given a ChartTextAppearance object (which can be retrieved directly from the ChartTextCollection by index after it has been added), setting a new Font and Color is as simple as setting a pair of properties (either at design-time or run-time).
In Visual Basic:
' Given the ChartType is PieChart.
' Create a new Chart Text Appearance object with
' default values for font, color, alignment, etc.
Dim text2 As ChartTextAppearance = New ChartTextAppearance()
' Identify which chart element this text applies to
' by its underlying data row and column indices.
text2.Row = 0
text2.Column = 0
' Give this piece of text something to say.
text2.ItemFormatString = "Hello"
' Show it.
text2.Visible = True
' Given the chart type is ColumnChart, add it to the
' ChartText collection.
Me.PieChart1.PieChart.ChartText.Add(text2)
' Set its ChartTextFont and FontColor properties.
text2.ChartTextFont = New Font("Arial", 12.0)
text2.Fontcolor = Color.Red
In C#:
// Given the ChartType is PieChart.
// Create a new Chart Text Appearance object with
// default values for font, color, alignment, etc.
ChartTextAppearance text2 = new ChartTextAppearance();
// Identify which chart element this text applies to
// by its underlying data row and column indices.
text2.Row = 0;
text2.Column = 0;
// Give this piece of text something to say.
text2.ItemFormatString = "Hello";
// Show it.
text2.Visible = true;
// Given the chart type is ColumnChart, add it to the
// ChartText collection.
this.PieChart1.PieChart.ChartText.Add(text2);
// Set its ChartTextFont and FontColor properties.
text2.ChartTextFont = new Font( "Arial", 12f);
text2.FontColor = Color.Red;
Since the Font object exposes properties govering its size and weight (boldness) as read-only, these characteristics of a Font can be changed only by constructing a new Font object. Developers could bolden a piece of chart text (without changing its current font face) as follows:
In Visual Basic:
' Given the ChartType is PieChart.
Dim oldFont As Font = Me.PieChart1.PieChart.ChartText(0).ChartTextFont
Me.PieChart1.PieChart.ChartText(0).ChartTextFont = _
New Font( oldFont.FontFamily, oldFont.Size, FontStyle.Bold)
oldFont.Dispose()
oldFont = Nothing
In C#:
// Given the ChartType is PieChart.
Font oldFont = this.PieChart1.PieChart.ChartText[0].ChartTextFont;
this.PieChart1.PieChart.ChartText[0].ChartTextFont =
new Font( oldFont.FontFamily, oldFont.Size, FontStyle.Bold);
oldFont.Dispose();
Chart text can be displayed with a variety of alignments, as shown in this table of the nine possible Column Chart text alignments.
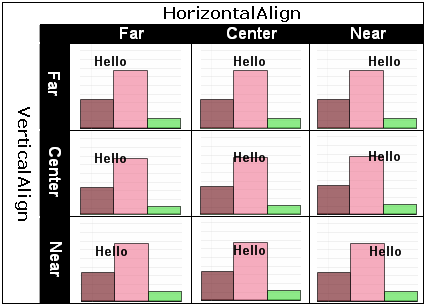
Then given a ChartTextAppearance object, changing its alignment to centered along both its imaginary horizontal and vertical axes of symmetry (so that it is bisected by these symmetric axes) can be done with simple property assignments either at run-time or design-time.
In Visual Basic:
' Given text As ChartTextAppearance.
text.VerticalAlign = StringAlignment.Center
text.HorizontalAlign = StringAlignment.Center
In C#:
// Given text IS-A ChartTextAppearance object.
text.VerticalAlign = StringAlignment.Center;
text.HorizontalAlign = StringAlignment.Center;
The enumeration used for alignment is the same as that used by the .NET Framework (and defined in its System.Drawing namespace). It might be seem convenient to use alignments like Left and Right, but this enumeration uses the notions of Near and Far in relation to the localized writing system (supporting languages read from right-to-left with the same code as that employed for left-to-right languages).
Observe also that the visual magnitude of an alignment change frequently depends on the characteristics of the underlying chart. For example, the horizontal bars on a Bar Chart do not have much height, therefore the visual effect of changes to the VerticalAlign property are much more mild than they would be in a column chart.
Here is how some chart text with a variety of alignments can be added to a chart, in this example we assume that the chart is a bar chart and so the ChartTextCollection is the ChartText property of the BarChartAppearance class.
In Visual Basic:
' Given ChartType is BarChart.
Me.UltraChart1.BarChart.ChartText.Add( _
New ChartTextAppearance(Me.UltraChart1, 0, 0, True, New Font("Arial", 10.0), _
Color.Black, "The", StringAlignment.Center, StringAlignment.Near, 0))
Me.UltraChart1.BarChart.ChartText.Add( _
New ChartTextAppearance(Me.UltraChart1, 1, 0, True, New Font("Verdana", 10.0), _
Color.Purple, "quick", StringAlignment.Near, StringAlignment.Center, 0))
Me.UltraChart1.BarChart.ChartText.Add( _
New ChartTextAppearance(Me.UltraChart1, 2, 0, True, New Font("Times Roman", 12.0), _
Color.Brown, "brown", StringAlignment.Center, StringAlignment.Far, 0))
Me.UltraChart1.BarChart.ChartText.Add( _
New ChartTextAppearance(Me.UltraChart1, 3, 0, True, New Font("Arial", 14.0), _
Color.Navy, "fox", StringAlignment.Far, StringAlignment.Center, 0))
In C#:
// Given ChartType is BarChart.
this.ultraChart1.BarChart.ChartText.Add(
    new ChartTextAppearance(this.ultraChart1, 0, 0, true, new Font("Arial", 10f),
    Color.Black, "The", StringAlignment.Center, StringAlignment.Near, 0));
this.ultraChart1.BarChart.ChartText.Add(
    new ChartTextAppearance(this.ultraChart1, 1, 0, true, new Font("Verdana", 10f),
    Color.Purple, "quick", StringAlignment.Near, StringAlignment.Center, 0));
this.ultraChart1.BarChart.ChartText.Add(
    new ChartTextAppearance(this.ultraChart1, 2, 0, true,
    new Font("Times Roman", 12f),
    Color.Brown, "brown", StringAlignment.Center, StringAlignment.Far, 0));
this.ultraChart1.BarChart.ChartText.Add(
    new ChartTextAppearance(this.ultraChart1, 3, 0, true, new Font("Arial", 14f),
    Color.Navy, "fox", StringAlignment.Far, StringAlignment.Center, 0));
The outcome of this code is a chart presentation shown in the following figure. This example merits further discussion regarding how different alignments appear differently depending on chart type.
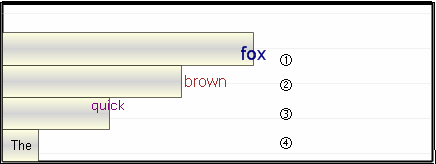
The text "fox" is vertically aligned far, so it appears far from the top edge of the horizontal bar. It does not appear to contact the bottom edge of the bar because of the font family’s descent spacing (spacing between lines to accomodate characters such as 'g' or 'y' that descend below the baseline).
The text "brown" is horizontally aligned far, so it appears far from the left edge of the screen, and completely right of the bar. It is also vertically centered relative to the bar, as shown by its alignment with the gradient.
The text "quick" is vertically aligned near, so it’s top edge appears adjacent to the top edge of the horizontal bar. It is also horizontally centered, so that the text is bisected by the right edge of the bar.
The text "The" is horizontally aligned near, so it appears completely to the left of the right edge of the horizontal bar.
When aligning text horizontally near on short bars, or horizontally far on long bars (as in case 4 above), it is the responsibility of the application logic to ensure the entire text remains visible. Developers can base this decision on the font metrics for the size and style of font used to get the width or height it requires, and then make a compensatory adjustment to the HorizontalAlign or VerticalAlign as necessary.
Thus far this topic has only used ItemFormatString to present a literal text value onto the chart. Such a simplification greatly understates the powerful functionality of this property. As its name may suggest, this property accepts custom labeling keywords (provided they are appropriate to the currently active chart type) that render dynamic values to any chart element.
Here is an example of how data from an application’s data source can furnish the content of a Bubble Chart’s text labels:
In Visual Basic:
Dim text(4) As ChartTextAppearance
Dim i As Integer
For i = 0 To text.Length - 1
	text(i) = New ChartTextAppearance()
	text(i).Visible = True
	text(i).ItemFormatString = "<DATA_VALUE_RADIUS:#0.00>"
	text(i).Row = i
	text(i).Column = 2
	Me.BubbleChart1.BubbleChart.ChartText.Add(text(i))
Next i
In C#:
ChartTextAppearance[] text = new ChartTextAppearance[4];
for ( int i = 0; i < text.Length; ++i)
{
    text[i] = new ChartTextAppearance();
    text[i].Visible = true;
    text[i].ItemFormatString = "<DATA_VALUE_RADIUS:#0.00>";
    text[i].Row = i;
    text[i].Column = 2;
    this.ultraChart1.BubbleChart.ChartText.Add( text[ i]);
}
The preceding code creates an array of ChartTextAppearance objects based on the number of chart elements that will be appearing in a bubble chart (one bubble per row.) This technique is equally applicable to a column or bar chart where the number of chart elements can be calculated by rows X columns.
Instead of setting the ItemFormatString property to some literal text for display, the example sets it to a label keyword. When this code is run, it produces chart text labels declaring the radius of the bubble centered within the bubble, as seen in this illustration.
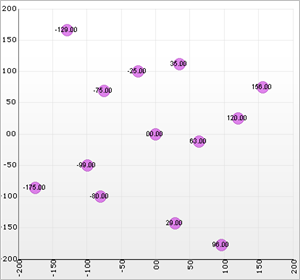
The <DATA_VALUE_RADIUS> keyword is specific to Bubble chart, but an application can use whatever labeling keywords are available to the active chart type or for which a custom IRenderLabel has been added to the LabelHash. See Use Predefined and Custom Label Styles for more information.