Imports Infragistics.UltraChart.Shared.Styles

By default, the Chart control will choose random colors for the charting elements. But you can assign a specific color to each bar, bubble, line, etc. You do this by using the ColorModel object.
Before you start writing any code, you should place using/import directives in your code-behind so you don’t need to always type out a member’s fully qualified name.
In Visual Basic:
Imports Infragistics.UltraChart.Shared.Styles
In C#:
using Infragistics.UltraChart.Shared.Styles;
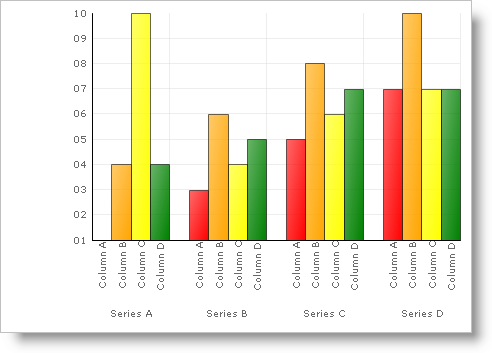
ColorModel.ModelStyle to CustomLinear. This tells the Chart to use the colors from the CustomPalette in order.
In Visual Basic:
Me.UltraChart1.ColorModel.ModelStyle = ColorModels.CustomLinear
In C#:
this.ultraChart1.ColorModel.ModelStyle = ColorModels.CustomLinear;
To assign specific colors to specific elements, you must set the CustomPalette to an array of color objects.
In Visual Basic:
Dim ChartColors() As Color
ChartColors = New Color() {Color.Red, Color.Orange, Color.Yellow, _
  Color.Green, Color.Blue, Color.Indigo, Color.Violet}
Me.UltraChart1.ColorModel.CustomPalette = ChartColors
In C#:
Color[] ChartColors;
ChartColors = new Color[] {Color.Red, Color.Orange, Color.Yellow,
  Color.Green, Color.Blue, Color.Indigo, Color.Violet};
this.ultraChart1.ColorModel.CustomPalette = ChartColors;