
In the Infragistics 2005 Volume 1 release, a new item called Annotations was added to the Chart control. These graphical elements can be used to provide a visual cue or information supplemental to the existing chart data. They can take the form of additional labels, arrows, or other shapes which point to a particular location on the chart.
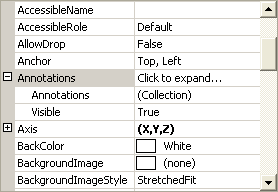
In the form’s Properties window, double-click the Annotations property to expand it.
Under the Annotations property, click the Annotations property, and click the ellipsis (…) button to open the Chart Annotations Editor dialog box.
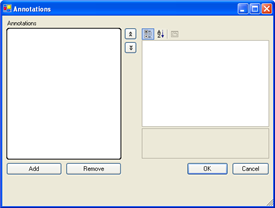
In the dialog box, click Add to display the drop-down list. editor click the add button on the left this will show a drop down with all the available annotations you can use.
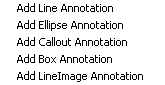
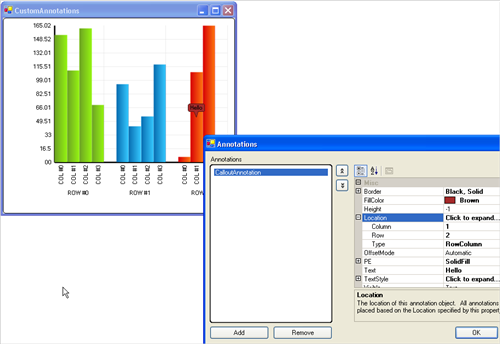
For this example procedure, select Add Callout Annotation from the drop-down menu. The CalloutAnnotation property is added to the Annotations listbox in the left-hand pane of the dialog box, and its properties are displayed in the right-hand pane of the dialog box.
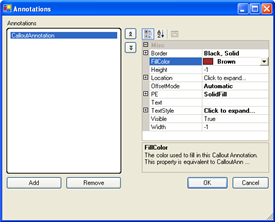
In the right-hand pane of the dialog box, click the Location property to expand it. The Location property is one of the most fundamental properties of all chart annotations.
When working with the Location property, the first question you need to ask is "Which location type should be used for this annotation?". Under the Location property, click the Type property, and click the drop-down arrow to display the available location types:
LocationType.RowColumn — The annotation is placed on top of each chart data item matching its Row and Column properties. These values should be set to match the zero-based indices of the rows and columns to match in the data source. To match all rows and/or columns, set the Row and/or Column property to -2. This value is the "wildcard" value for row and/or column matching.
LocationType.DataValues — The annotation is placed at a point mapped on the X and Y axes. The values to map on these axes are specified by the Location’s ValueX and ValueY properties.
LocationType.Pixels — The annotation is placed at a point based on a pixel distance from the top-left corner of the chart. These horizontal and vertical (X and Y) pixel distances are specified by the Location’s LocationX and LocationY properties.
LocationType.Percentage — The annotation is placed at a point based on a percentage distance from the top-left corner of the chart. These horizontal and vertical (X and Y) percentage distances are specified by the Location’s LocationX and LocationY properties. In order for the annotation to be visible in the chart area, these values must be between 0 and 100.
Leave the Type property set to the default value of RowColumn .
Change the value of the Column property to 1.
Change the value of the Row property to 2.
Click the Text property, and type a name for the callout annotation. Click outside of the Text property field, and move the Chart Annotations Editor dialog box so you can see your callout annotation displayed on the chart.
In the right-hand area of the Chart Annotations Editor dialog box, double-click the PE ( PaintElement ) property. This property allows you to change the appearance of your annotation. .
For this example procedure, change the following property settings: ElementType property — Gradient Fill property — Brown FillGradientStyle property — Horizontal FillStopColor property — RosyBrown
Your chart annotation should looks similar to the annotation in the screenshot below.