Creating a Composite Chart in Code (Part 2 of 2)
-
Add another axis to the ChartArea.
Before adding another chart layer, it is necessary to add at least one more axis. This is required because most chart layers require an axis for labels, and chart layers cannot share a label axis.
Go back to the ChartArea’s Axes collection and add a horizontal axis and set its OrientationType property to "X2_Axis." This will add an axis oriented from the top of the chart.
Dim axisX2 As New AxisItem()
axisX2.OrientationType = AxisNumber.X2_Axis
axisX2.DataType = AxisDataType.Numeric
axisX2.Labels.ItemFormatString = ""
axisX2.Labels.Orientation = TextOrientation.VerticalLeftFacing
axisX2.Extent = 40
myChartArea.Axes.Add(axisX2)
AxisItem axisX2 = new AxisItem();
axisX2.OrientationType = AxisNumber.X2_Axis;
axisX2.DataType = AxisDataType.Numeric;
axisX2.Labels.ItemFormatString = "";
axisX2.Labels.Orientation = TextOrientation.VerticalLeftFacing;
axisX2.Extent = 40;
myChartArea.Axes.Add(axisX2);
The next chart layer will be for a ScatterChart, which requires XY data; so it will be necessary to add one or more XYSeries.
Additionally, this code demonstrates the use of the Series.PEs property to customize the colors used when rendering a series.
Functions which provide sample XY data, GetXYSeriesBound() and GetXYSeriesUnBound(), are provided:
Private Function GetXYSeriesBound() As XYSeries
	Dim series As New XYSeries()
	series.Label = "Series C"
	' this code populates the series from an external data source
	Dim table As DataTable = GetData()
	series.Data.DataSource = table
	series.Data.LabelColumn = "Label Column"
	series.Data.ValueXColumn = "Value Column"
	series.Data.ValueYColumn = "Another Value Column"
	Return series
End Function
Private Function GetXYSeriesUnBound() As XYSeries
	Dim series As New XYSeries()
	series.Label = "Series D"
	' this code populates the series using unbound data
	series.Points.Add(New XYDataPoint(1.0, 1.0, "Point A", False))
	series.Points.Add(New XYDataPoint(2.0, 2.0, "Point B", False))
	series.Points.Add(New XYDataPoint(3.0, 3.0, "Point C", False))
	series.Points.Add(New XYDataPoint(4.0, 4.0, "Point D", False))
	series.Points.Add(New XYDataPoint(5.0, 5.0, "Point E", False))
	Return series
End Function
private XYSeries GetXYSeriesBound()
{
	XYSeries series = new XYSeries();
	series.Label = "Series C";
	// this code populates the series from an external data source
	DataTable table = GetData();
	series.Data.DataSource = table;
	series.Data.LabelColumn = "Label Column";
	series.Data.ValueXColumn = "Value Column";
	series.Data.ValueYColumn = "Another Value Column";
	return series;
}
private XYSeries GetXYSeriesUnBound()
{
	XYSeries series = new XYSeries();
	series.Label = "Series D";
	// this code populates the series using unbound data
	series.Points.Add(new XYDataPoint(1.0, 1.0, "Point A", false));
	series.Points.Add(new XYDataPoint(2.0, 2.0, "Point B", false));
	series.Points.Add(new XYDataPoint(3.0, 3.0, "Point C", false));
	series.Points.Add(new XYDataPoint(4.0, 4.0, "Point D", false));
	series.Points.Add(new XYDataPoint(5.0, 5.0, "Point E", false));
	return series;
}
Dim seriesC As XYSeries = GetXYSeriesBound()
Dim seriesD As XYSeries = GetXYSeriesUnBound()
Me.UltraChart1.CompositeChart.Series.Add(seriesC)
Me.UltraChart1.CompositeChart.Series.Add(seriesD)
' Customize the series colors.
seriesC.PEs.Add(New PaintElement(Color.Green))
seriesD.PEs.Add(New PaintElement(Color.Blue))
XYSeries seriesC = GetXYSeriesBound();
XYSeries seriesD = GetXYSeriesUnBound();
this.ultraChart1.CompositeChart.Series.Add(seriesC);
this.ultraChart1.CompositeChart.Series.Add(seriesD);
// Customize the series colors.
seriesC.PEs.Add(new PaintElement(Color.Green));
seriesD.PEs.Add(new PaintElement(Color.Blue));
This code adds a chart layer with a ChartType of ScatterChart, then sets up its ChartArea and Axes and adds the XY series to it.
Dim myScatterLayer As New ChartLayerAppearance()
myScatterLayer.ChartType = ChartType.ScatterChart
CType(myScatterLayer.ChartTypeAppearance, _
  ScatterChartAppearance).ConnectWithLines = True
myScatterLayer.ChartArea = myChartArea
myScatterLayer.AxisX = axisX2
myScatterLayer.AxisY = axisY
myScatterLayer.Series.Add(seriesC)
myScatterLayer.Series.Add(seriesD)
Me.UltraChart1.CompositeChart.ChartLayers.Add(myScatterLayer)
' Add the second layer to the legend.
myLegend.ChartLayers.Add(myScatterLayer)
ChartLayerAppearance myScatterLayer = new ChartLayerAppearance();
myScatterLayer.ChartType = ChartType.ScatterChart;
((ScatterChartAppearance)myScatterLayer.ChartTypeAppearance).ConnectWithLines =
  true;
myScatterLayer.ChartArea = myChartArea;
myScatterLayer.AxisX = axisX2;
myScatterLayer.AxisY = axisY;
myScatterLayer.Series.Add(seriesC);
myScatterLayer.Series.Add(seriesD);
this.ultraChart1.CompositeChart.ChartLayers.Add(myScatterLayer);
// Add the second layer to the legend.
myLegend.ChartLayers.Add(myScatterLayer);
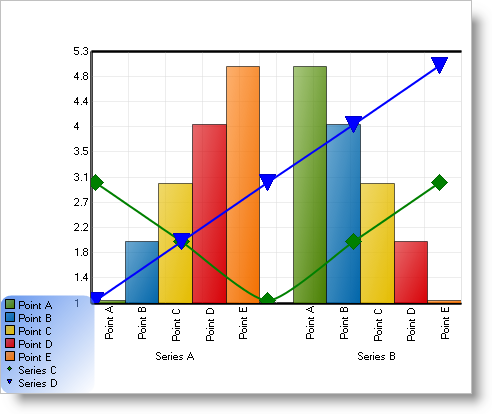
The chart using all the code in the above tutorial should look something like this:
By now you should be familiar enough with the Composite Chart Wizard to experiment on your own. You can add more chart layers, axes, legends, and chart areas freely to suit the needs of your application.