
This section expands on the topic, Creating a Composite Chart Using the Designer (Part 1 of 2), and demonstrates the power and flexibility of composite charts by adding more layers, chart areas, and legends.
Add another axis to the ChartArea .
Before adding another chart layer, it is necessary to add at least one more axis. This is required because most chart layers require an axis for labels, and chart layers cannot share a label axis.
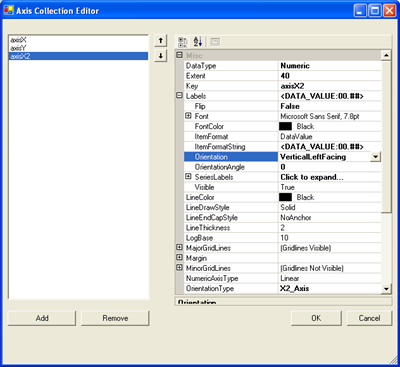
Go back to the ChartArea’s Axes collection and add a horizontal axis and set its OrientationType property to "X2_Axis." Assign a meaningful key like axisX2. This will add an axis oriented from the top of the chart.
Set the DataType to Numeric. Set the ItemLabels.ItemFormat to "DataValue" so that data values can be displayed on this axis. Set the ItemLabels.Orientation to "VerticalLeftFacing." Then change the Extent to 40 to allow more space for the chart.
Add another data series.
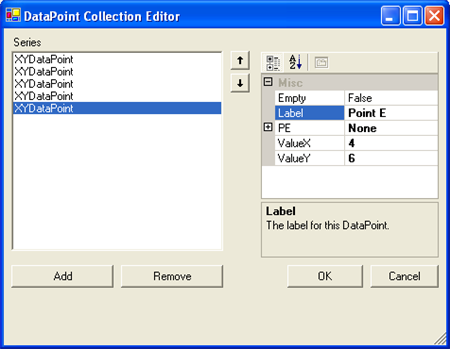
Return to the Series Collection editor by clicking on the ellipsis by the CompositeChart.Series property. Add an XY Series to the Series Collection. Then enter some data points with X and Y values.
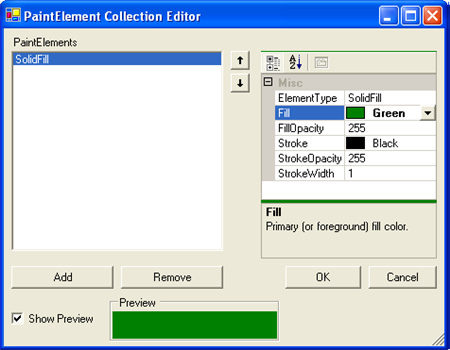
To assign this series a color, close the DataPoint Collection Editor to return to the Series Collection Editor. Then click the ellipsis by the PEs property for this series (series3) to open the PaintElement Collection Editor for that Series' PEs collection.
Add a single PaintElement by clicking the "Add" button and set its Fill color to a color (in this example, Green is used).
Add another chart layer.
Return to the ChartLayer collection editor by clicking on the ellipsis by the CompositeChart.ChartLayers property. Add a new ChartLayer to the collection, and set its ChartType property to ScatterChart.
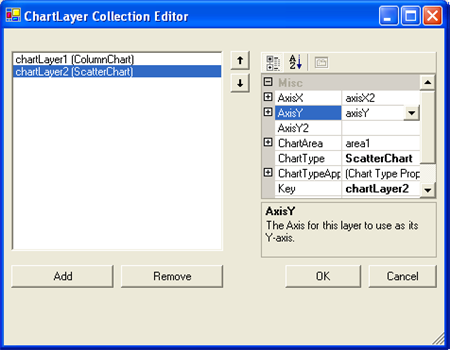
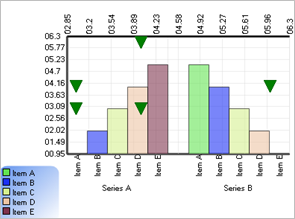
Open the ChartLayer’s Series Collection and select the XY Series (series3). Now close out of the collection editor and the second chart layer will appear.
By now you should be familiar enough with the Composite Chart Wizard to experiment on your own. You can add more chart layers, axes, legends, and chart areas freely to suit the needs of your application.