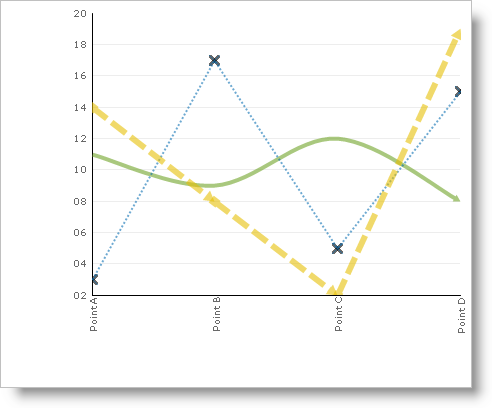

Starting in 2006 Volume 3, you can customize the appearance of each line in your 2D line and area charts, so that the data is more representative and informative to your end users. For example, in a line chart that contains three series, you can customize each line so that they are of varying thicknesses, spline tensions, and line styles, as shown in the screen shot below.
The example code below demonstrates how to use the various LineAppearance properties to make the appearance of each line (series) unique. For an overview of line appearances, and a description of each of the properties, see Line Appearances.
In Visual Basic:
Imports Infragistics.UltraChart.Resources.Appearance
Imports Infragistics.UltraChart.Shared.Styles
...
' Create LineAppearances objects and add them to the
' LineChart.LineAppearances collection.
Dim lineApp1 As New LineAppearance()
lineApp1.LineStyle.EndStyle = LineCapStyle.ArrowAnchor
lineApp1.SplineTension = 0.5
lineApp1.Thickness = 5
Me.ultraChart1.LineChart.LineAppearances.Add(lineApp1)
Dim lineApp2 As New LineAppearance()
lineApp2.LineStyle.DrawStyle = LineDrawStyle.Dot
lineApp2.Thickness = 3
lineApp2.IconAppearance.Icon = SymbolIcon.X
lineApp2.IconAppearance.PE.Fill = Color.Green
lineApp2.IconAppearance.PE.Stroke = Color.Green
Me.ultraChart1.LineChart.LineAppearances.Add(lineApp2)
Dim lineApp3 As New LineAppearance()
lineApp3.LineStyle.DrawStyle = LineDrawStyle.Dash
lineApp3.LineStyle.EndStyle = LineCapStyle.ArrowAnchor
lineApp3.LineStyle.MidPointAnchors = true
lineApp3.LineStyle.StartStyle = LineCapStyle.SquareAnchor
lineApp3.Thickness = 7
Me.ultraChart1.LineChart.LineAppearances.Add(lineApp3)
In C#:
using Infragistics.UltraChart.Resources.Appearance;
using Infragistics.UltraChart.Shared.Styles;
...
// Create LineAppearances objects and add them to the
// LineChart.LineAppearances collection.
LineAppearance lineApp1 = new LineAppearance();
lineApp1.LineStyle.EndStyle = LineCapStyle.ArrowAnchor;
lineApp1.SplineTension = 0.5;
lineApp1.Thickness = 5;
this.ultraChart1.LineChart.LineAppearances.Add(lineApp1);
LineAppearance lineApp2 = new LineAppearance();
lineApp2.LineStyle.DrawStyle = LineDrawStyle.Dot;
lineApp2.Thickness = 3;
lineApp2.IconAppearance.Icon = SymbolIcon.X;
lineApp2.IconAppearance.PE.Fill = Color.Green;
lineApp2.IconAppearance.PE.Stroke = Color.Green;
this.ultraChart1.LineChart.LineAppearances.Add(lineApp2);
LineAppearance lineApp3 = new LineAppearance();
lineApp3.LineStyle.DrawStyle = LineDrawStyle.Dash;
lineApp3.LineStyle.EndStyle = LineCapStyle.ArrowAnchor;
lineApp3.LineStyle.MidPointAnchors = true;
lineApp3.LineStyle.StartStyle = LineCapStyle.SquareAnchor;
lineApp3.Thickness = 7;
this.ultraChart1.LineChart.LineAppearances.Add(lineApp3);