Me.UltraChart1.Axis.Y.LogZero = 1.0

In order to allow you to plot Log(0) values without an exception being thrown, the Chart component allows you to specify a value when the axis tries to plot Log(0).
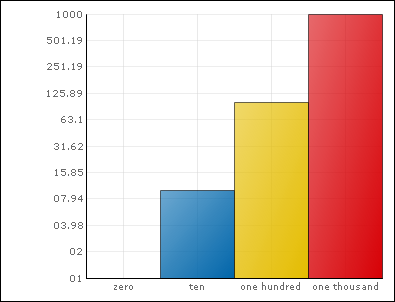
The following code sample allows a table or series with zero values to be plotted using the logarithmic y-axis. The minimum value of the axis is 1.0 and all zero values are plotted at 1.0.
In Visual Basic:
Me.UltraChart1.Axis.Y.LogZero = 1.0
In C#:
this.UltraChart1.Axis.Y.LogZero = 1.0;
The following screen shot shows a column chart with a logarithmic y-axis and a zero value.