In 2005 Volume 1 functionality was added to the chart so you can now set all the same properties you can set on the Item Labels, can now be set on the Series Labels, including rotating them.
This topic assumes the chart already has its DataSource property set. For information on how to do this, see Data Sources.
If you have the form open in design view select the chart, and in the properties grid navigate down to the Axis property. Once here expand the Axis property, you will notice all the axis available are listed, they all have the same properties available so we will only concentrate on one of them. So expand the X property, then under that expand the Labels property.
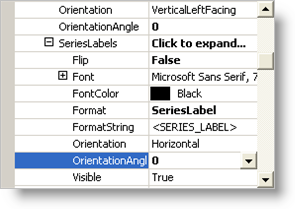
You will notice several properties available, these properties at this level apply to the Item Labels. To see the Series Labels properties expand the SeriesLabels property. You notice the similarity between the Item Labels available properties and the Series Labels available properties.

One of the biggest benefits that this new functionality gives you, is the ability to rotate the Series Labels. To do this under the SeriesLabels, there are two properties you can change to rotate these labels. One is the Orientation , by changing this property to one of the other options you can rotate the labels. The final option for the Orientation called Custom allows you to set the OrientationAngle property to any angle to rotate the labels to.
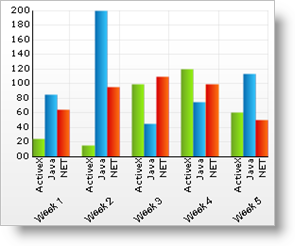
For example, if you set the Orientation property to Custom, and set the OrientationAngle property to 40, your chart’s Series Labels will rotate and look similar to the screen shot below.
