
This topic explains, with code examples, how to use BubbleSeries in the UltraDataChart™ control. Some important conceptual information is provided as well.
This topic contains the following sections:
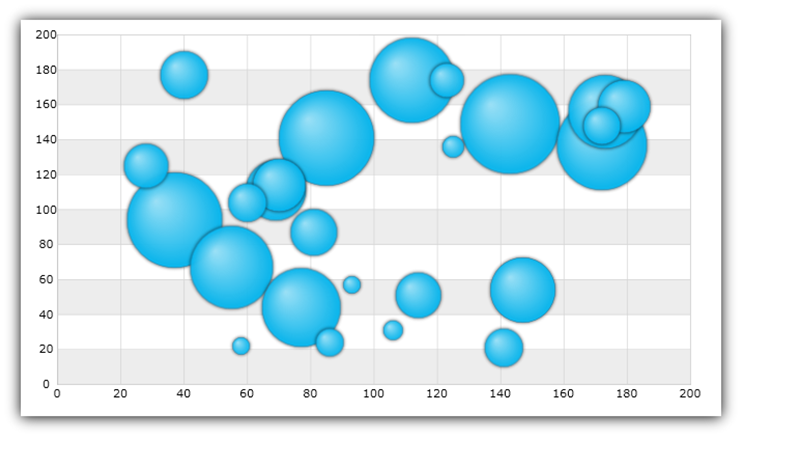
The BubbleSeries belongs to a family of Scatter Series that use the Cartesian (x, y) coordinate system to plot data. This series displays the data as a collection of scaled bubbles, each having a pair of numeric X/Y values that determines its location in the Cartesian coordinate system and 3rd value that determines its size.
Scatter Series draw attention to uneven intervals or clusters of data. They can highlight the deviation of collected data from predicted results and they are often used to plot scientific and statistical data. In addition to these characteristics of Scatter Series, the sizes of BubbleSeries markers (bubbles) in are data-driven. The following sections list important conceptual and task-based information on how to use the BubbleSeries and its features.
Figure 1: Sample implementation of the BubbleSeries
The BubbleSeries uses the DataSource property to bind any data object that implements the IEnumerable interface (e.g. List, Collection, Queue, Stack). However, each data item in this object must have one numeric data column (for the size of a bubble) in addition to two numeric data columns (for X and Y values to position a bubble in the Cartesian coordinate system). These data columns are mapped using RadiusMemberPath, XMemberPath, and YMemberPath properties.
An example of object that meets the criteria listed above is the BubbleDataSource which you can download use it in your project.
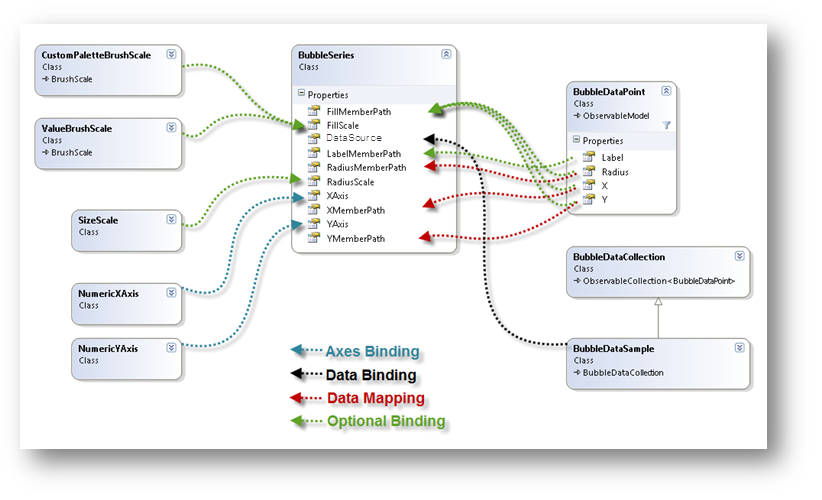
Figure 2: Schematic representation of binding data to BubbleSeries in the UltraDataChart control.
This code snippet below demonstrates how to bind sample bubble data to the BubbleSeries.
In C#:
var data = new BubbleDataSource();
var xAxis = new NumericXAxis();
var yAxis = new NumericYAxis();

var series = new BubbleSeries();
series.XAxis = xAxis;
series.YAxis = yAxis;
series.XMemberPath = "X";
series.YMemberPath = "Y";
series.RadiusMemberPath = "Radius";
series.DataSource = data;
DataChart.Axes.Add(xAxis);
DataChart.Axes.Add(yAxis);
DataChart.Series.Add(series);
In Visual Basic:
Dim data As New BubbleDataSource()
Dim xAxis As New NumericXAxis()
Dim yAxis As New NumericYAxis()

Dim series As New BubbleSeries()
series.DataSource = data
series.XMemberPath = "X"
series.YMemberPath = "Y"
series.RadiusMemberPath = "Radius"
series.XAxis = xAxis
series.YAxis = yAxis
Dim chart As New UltraDataChart()
chart.Axes.Add(xAxis)
chart.Axes.Add(yAxis)
chart.Series.Add(series)Bubble Size Scale is an optional feature of BubbleSeries that determines the sizes of bubbles though the RadiusScale property of the series. This feature is implemented through the SizeScale object. When the radius scale is set, the smallest bubble will be equal to MinimumValue, the largest bubble will be equal to MaximumValue, and all the remaining bubbles will be scaled accordingly. The size scale can be either linear or logarithmic. When the radius scale is not set, each bubble’s size is equal to the value of data column mapped to RadiusMemberPath property.
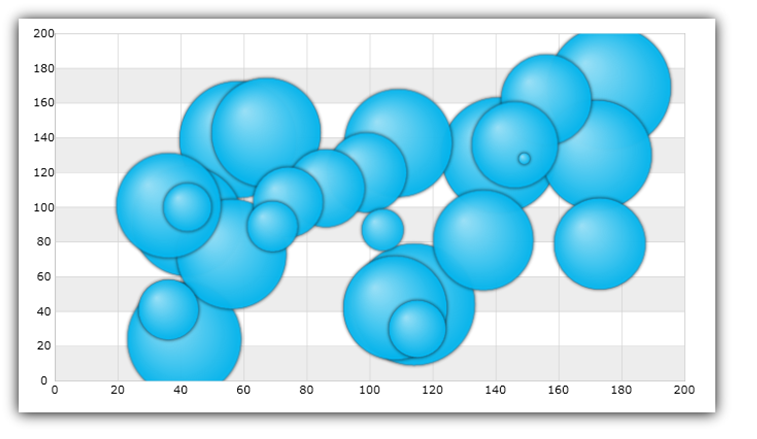
Figure 3: Sample implementation of the Bubble Size Scale
This code snippet demonstrates how to scale size of bubbles in the BubbleSeries using SizeScale object.
In Visual Basic:
Dim sizeScale As New SizeScale()
sizeScale.IsLogarithmic = False
sizeScale.MinimumValue = 20
sizeScale.MaximumValue = 120
Dim series As New BubbleSeries()
series.RadiusScale = sizeScale
In C#:
SizeScale sizeScale = new SizeScale();
sizeScale.IsLogarithmic = false;
sizeScale.MinimumValue = 20;
sizeScale.MaximumValue = 120;
BubbleSeries series = new BubbleSeries();
series.RadiusScale = sizeScale;The Bubble Brush Scale is an optional feature which determines the color pattern within a single BubbleSeries though the series object’s FillScale property. The BubbleSeries supports the following brush scales:
Custom Brush Scale
Value Brush Scale
Each scale has a collection of brushes which defines color pattern. The scales are explained in the sub-sections that follow.
The CustomPaletteBrushScale uses the index of a bubble marker to select a brush from the Brushes collection. When the BrushSelectionMode property is set to the Select enumerable value, the bubbles are colored sequentially. When BrushSelectionMode is set to Interpolate, the brush is interpolated based on the bubble’s index and the number of brushes in the collection.
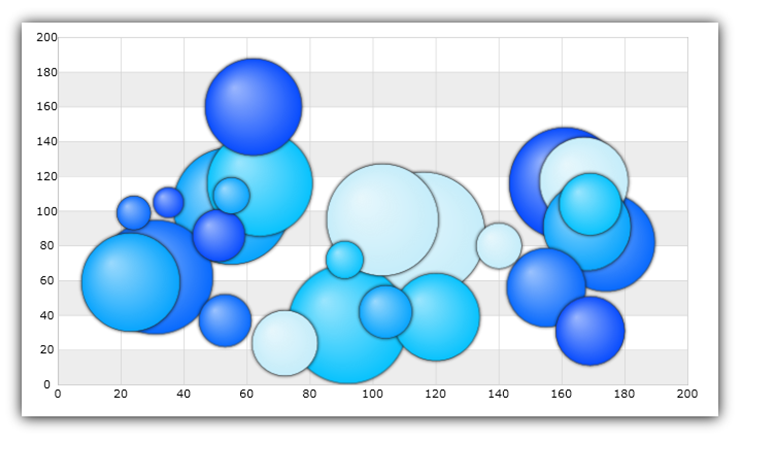
Figure 4: Sample implementation of the Custom Brush Scale
This code snippet demonstrates how to fill the color of the bubbles in the BubbleSeries using CustomPaletteBrushScale object.
In C#:
var brushCollection = new BrushCollection();
brushCollection.Add(new SolidColorBrush(Color.FromArgb(0xFF, 0xC6, 0xEE, 0xFB)));
brushCollection.Add(new SolidColorBrush(Color.FromArgb(0xFF, 0x08, 0xC3, 0xFE)));
brushCollection.Add(new SolidColorBrush(Color.FromArgb(0xFF, 0x08, 0xA5, 0xFE)));
brushCollection.Add(new SolidColorBrush(Color.FromArgb(0xFF, 0x08, 0x6A, 0xFE)));
brushCollection.Add(new SolidColorBrush(Color.FromArgb(0xFF, 0x08, 0x4C, 0xFE)));
var brushScale = new CustomPaletteBrushScale();
brushScale.BrushSelectionMode = BrushSelectionMode.Interpolate;
brushScale.Brushes = brushCollection;
var series = new BubbleSeries();
series.FillScale = brushScale;
series.FillMemberPath = "Radius";
In Visual Basic:
Dim brushCollection As New BrushCollection()
brushCollection.Add(New SolidColorBrush(Color.FromArgb(&HFF, &HC6, &HEE, &HFB)))
brushCollection.Add(New SolidColorBrush(Color.FromArgb(&HFF, &H08, &HC3, &HFE)))
brushCollection.Add(New SolidColorBrush(Color.FromArgb(&HFF, &H08, &HA5, &HFE)))
brushCollection.Add(New SolidColorBrush(Color.FromArgb(&HFF, &H08, &H6A, &HFE)))
brushCollection.Add(New SolidColorBrush(Color.FromArgb(&HFF, &H08, &H4C, &HFE)))
Dim brushScale As New CustomPaletteBrushScale()
brushScale.BrushSelectionMode = BrushSelectionMode.Interpolate
brushScale.Brushes = brushCollection
Dim series As New BubbleSeries()
series.FillScale = brushScale
series.FillMemberPath = "Radius"The ValueBrushScale uses a set of values from one of the numeric columns in the ItemsSource to determine an interpolated brush for bubbles. The column is specified with FillMemberPath property. This axis scale can be linear or logarithmic. Also, it can have user-specified MinimumValue and MaximumValue. When a range is set on this scale, bubbles with values that fall outside the range do not get a brush from the Brushes collection and are not colored.
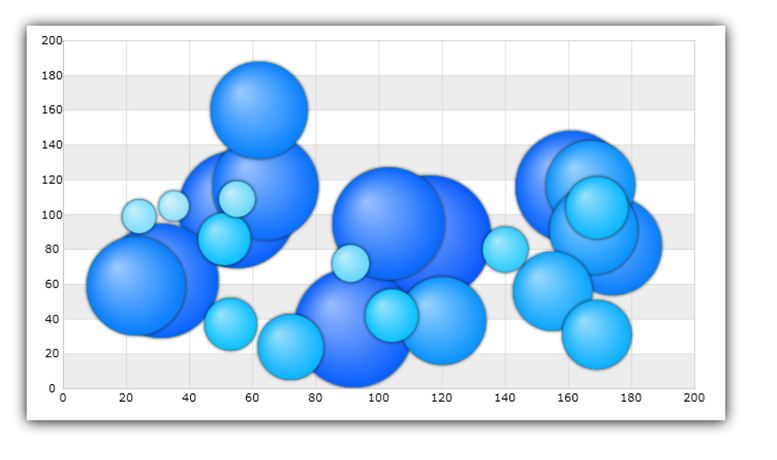
Figure 5: Sample implementation of the Value Brush Scale
This code snippet demonstrates how to fill the color of the bubbles in the BubbleSeries using ValueBrushScale object.
In C#:
var brushCollection = new BrushCollection();
brushCollection.Add(new SolidColorBrush(Color.FromArgb(0xFF, 0xC6, 0xEE, 0xFB)));
brushCollection.Add(new SolidColorBrush(Color.FromArgb(0xFF, 0x08, 0xC3, 0xFE)));
brushCollection.Add(new SolidColorBrush(Color.FromArgb(0xFF, 0x08, 0xA5, 0xFE)));
brushCollection.Add(new SolidColorBrush(Color.FromArgb(0xFF, 0x08, 0x6A, 0xFE)));
brushCollection.Add(new SolidColorBrush(Color.FromArgb(0xFF, 0x08, 0x4C, 0xFE)));
var brushScale = new ValueBrushScale();
brushScale.IsLogarithmic = False
brushScale.MinimumValue = 5
brushScale.MaximumValue = 200
brushScale.Brushes = brushCollection;
var series = new BubbleSeries();
series.FillScale = brushScale;
series.FillMemberPath = "Radius";
In Visual Basic:
Dim brushCollection As New BrushCollection()
brushCollection.Add(New SolidColorBrush(Color.FromArgb(&HFF, &HC6, &HEE, &HFB)))
brushCollection.Add(New SolidColorBrush(Color.FromArgb(&HFF, &H08, &HC3, &HFE)))
brushCollection.Add(New SolidColorBrush(Color.FromArgb(&HFF, &H08, &HA5, &HFE)))
brushCollection.Add(New SolidColorBrush(Color.FromArgb(&HFF, &H08, &H6A, &HFE)))
brushCollection.Add(New SolidColorBrush(Color.FromArgb(&HFF, &H08, &H4C, &HFE)))
Dim brushScale As New ValueBrushScale()
brushScale.Brushes = brushCollection
brushScale.IsLogarithmic = False
brushScale.MinimumValue = 5
brushScale.MaximumValue = 200
Dim series As New BubbleSeries()
series.FillScale = brushScale
series.FillMemberPath = "Radius"The BubbleSeries supports the following types of legends:
For details on the supported legends and how to use them with BubbleSeries, refer to the Chart Legends topic.