
This topic provides information on how to configure UltraLegend control and explains, with code examples, how to use it with Chart Series in the UltraDataChart™ control.
The topic is organized as follows:
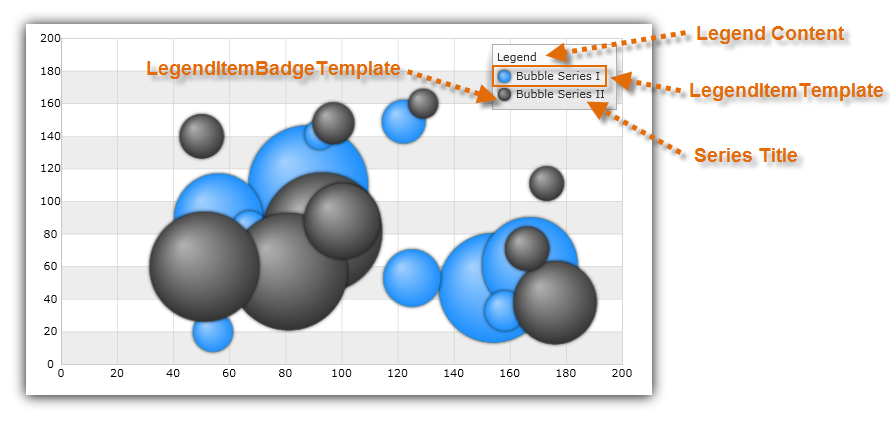
The basic Legend control identifies the title of a series with its visual representation of data in the chart plot area. Legend’s visuals consist of a list of legend items that have legend badge representing color of series as well as legend text that matches title of a series.
The Legend control supports any type of Chart Series and it will display legend item for each series in the chart plot area.
This code snippet demonstrates how to share Legend between two BubbleSeries objects as shown on Figure 1.
Figure 1: Basic Legend with two Bubble Series
In C#:
using Infragistics.Win.DataVisualization;
var legend = new UltraLegend;
var series1 = new BubbleSeries();
series1.Title = "Bubble Series I";
series1.Legend = legend;
var series2 = new BubbleSeries();
series2.Title = "Bubble Series II";
series2.Legend = legend;
var DataChart = new UltraDataChart();
...
dataChart.Series.Add(series1);
dataChart.Series.Add(series2);
In Visual Basic:
Dim itemLegend As New ItemLegend
Dim series As New BubbleSeries()
series.LabelMemberPath = "Label"
series.Legend = itemLegend
Dim dataChart As New UltraDataChart()
dataChart.Series.Add(series)