
This topic provides information on how to configure UltraScaleLegend control and explains, with code examples, how to use it with Chart Series in the UltraDataChart™ control.
The topic is organized as follows:
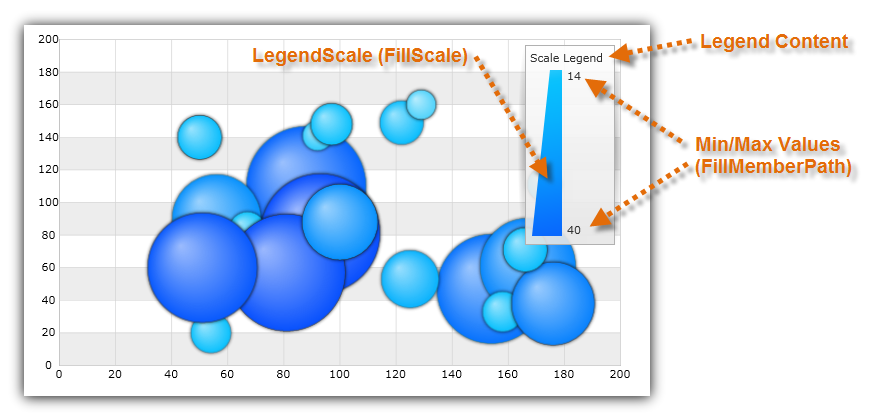
The Scale Legend is a special type of legend that shows how the colors in the Brushes collection of the ValueBrushScale or CustomPaletteBrushScale are distributed among bubbles of the BubbleSeries. It also displays the lowest and the highest values from a data column that is mapped to the FillMemberPath property of BubbleSeries. For more information on how to use brush scales, please refer to the Scatter Bubble Series topic.
The Item Legend control shares common properties with other type of chart legends. Refer to the Chart Legends topic for a complete list of these common properties.
The Scale Legend can be used with BubbleSeries only if the series meet the binding requirements listed in the following table.
This code snippet demonstrates how to bind Scale Legend to Bubble Series with ValueBrushScale as a fill scale of bubbles
Figure 2: A ScaleLegend bound to BubbleSeries with ValueBrushScale as a fill scale of bubbles
In C#:
using Infragistics.Win.DataVisualization;
...
var scaleLegend = new UltraScaleLegend;
var brushCollection = new BrushCollection();
brushCollection.Add(new SolidColorBrush(Color.FromArgb(0xFF, 0xC6, 0xEE, 0xFB)));
brushCollection.Add(new SolidColorBrush(Color.FromArgb(0xFF, 0x08, 0xC3, 0xFE)));
brushCollection.Add(new SolidColorBrush(Color.FromArgb(0xFF, 0x08, 0xA5, 0xFE)));
brushCollection.Add(new SolidColorBrush(Color.FromArgb(0xFF, 0x08, 0x6A, 0xFE)));
brushCollection.Add(new SolidColorBrush(Color.FromArgb(0xFF, 0x08, 0x4C, 0xFE)));
var brushScale = new ValueBrushScale();
brushScale.Brushes = brushCollection;
brushScale.MinimumValue = 5;
brushScale.MaximumValue = 200;
var series = new BubbleSeries();
series.FillScale = brushScale;
series.FillMemberPath = "Radius";
series.Legend = scaleLegend;
...
var DataChart = new UltraDataChart();
dataChart.Series.Add(series);
In Visual Basic:
Imports Infragistics.Win.DataVisualization
...
Dim scaleLegend As New UltraScaleLegend
Dim brushCollection As New BrushCollection()
brushCollection.Add(New SolidColorBrush(Color.FromArgb(&Hff, &HC6, &Hee, &Hfb)))
brushCollection.Add(New SolidColorBrush(Color.FromArgb(&Hff, &H08, &Hc3, &Hfe)))
brushCollection.Add(New SolidColorBrush(Color.FromArgb(&Hff, &H08, &Ha5, &Hfe)))
brushCollection.Add(New SolidColorBrush(Color.FromArgb(&Hff, &H08, &H6a, &Hfe)))
brushCollection.Add(New SolidColorBrush(Color.FromArgb(&Hff, &H08, &H4c, &Hfe)))
Dim brushScale As New ValueBrushScale()
brushScale.Brushes = brushCollection
brushScale.MinimumValue = 5
brushScale.MaximumValue = 200
Dim series As New BubbleSeries()
series.FillScale = brushScale
series.FillMemberPath = "Radius"
series.Legend = scaleLegend
...
Dim dataChart As New UltraDataChart()
dataChart.Series.Add(series)