
This topic demonstrates creating the WinForms UltraDataChart™ control using the Visual Studio 2013-2017 designer interface.
The following topics are prerequisites to understanding this topic:
This topic contains the following sections:
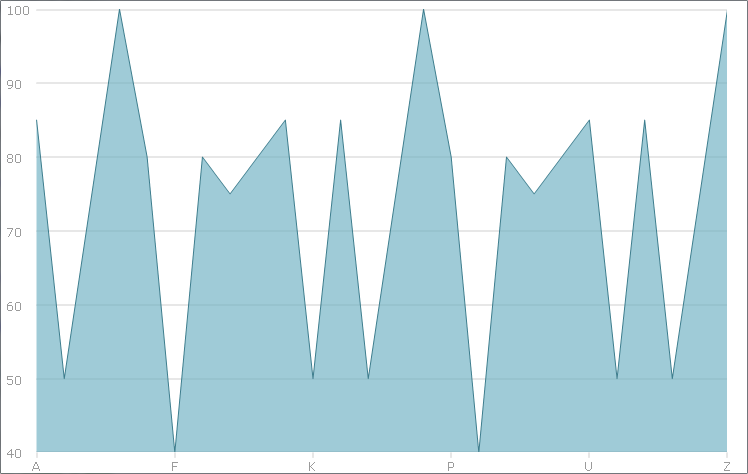
The following is the preview of the result of this topic.
The following table lists requirements for creating the UltraDataChart control
Create WinForms application project using Visual Studio 2013-2017 or later version.
Adding assemblies to the project is unnecessary, because when you drop the chart control on to the form, Visual Studio 2013-2017 will automatically add the following assemblies:
Infragistics.Win.DataVisualization.Shared.dll
Infragistics.Win.DataVisualization.UltraDataChart.dll
Infragistics.Win.Portable.Core.dll
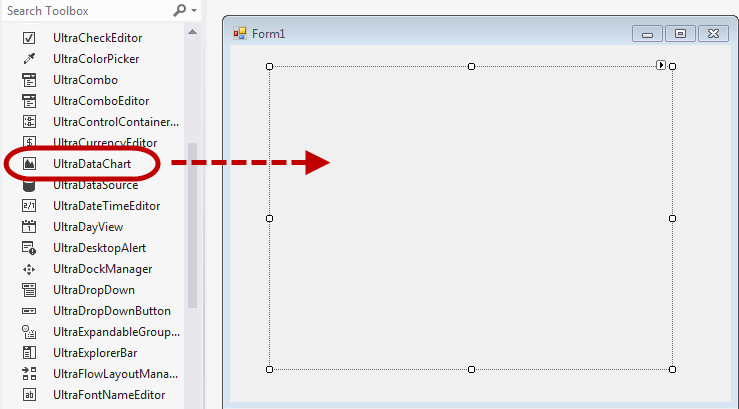
Drag and drop the UltraDataChart control from the Visual Studio 2013-2017 toolbox area on to a form as it is illustrated in the following screenshot:
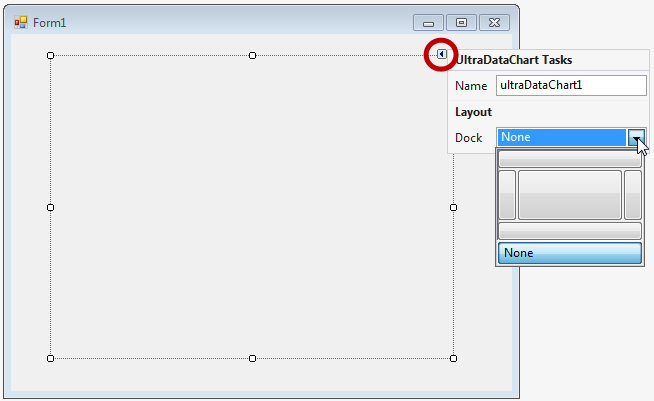
The control contains a smart tag, located in the control’s upper-right corner.
Click the arrow of the smart tag to drop down the task list. It contains Name and Dock properties for design-time customization.
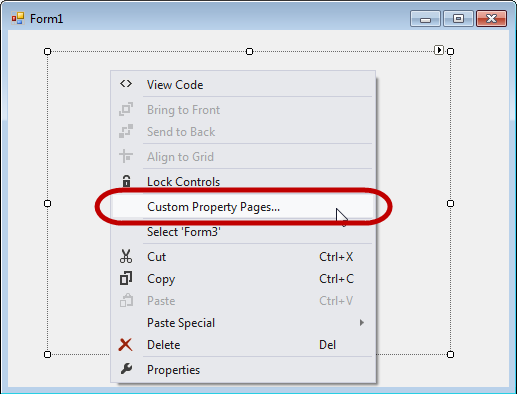
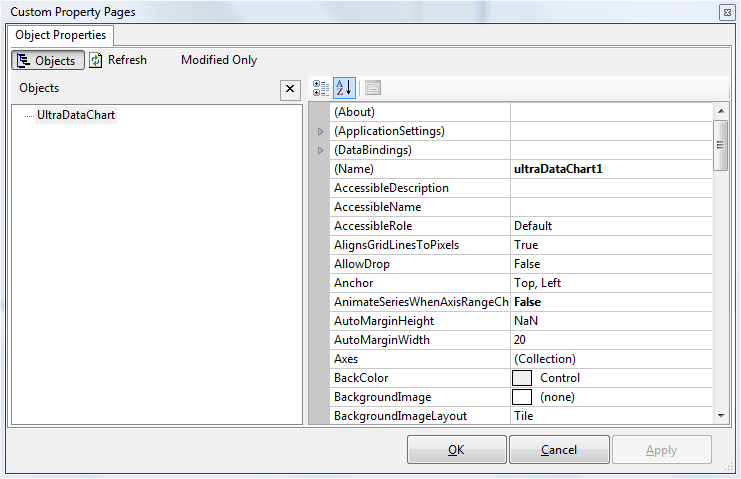
The UltraDataChart control exposes its properties in the Visual Studio 2013-2017 property grid as well as via "Custom Property Pages" dialog. Right-click on the chart control and select "Custom Property Pages" dialog window.
This dialog window provides a convenient way of customizing the control, ability to refresh and see the changes, and view the modified properties only.
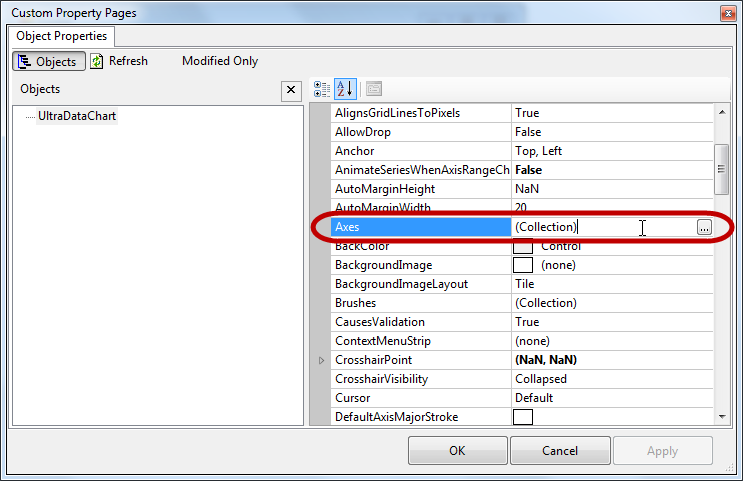
Next to the Axes property, click the ellipse (…) button to open a dialog editor. In this Axes Collection Editor, you can add axis objects to the chart control.
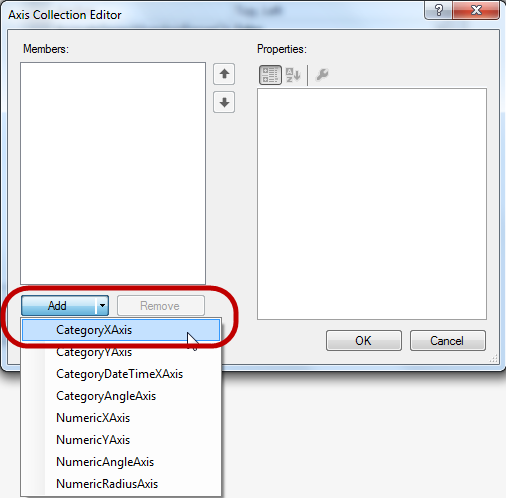
The Axes Collection Editor contains an "Add" button allowing you to select axis type from the list. Select a CategoryXAxis for horizontal axis, and a NumericYAxis for the vertical axis for the purpose of this demonstration, and click OK to add both axis to Axes collection of the chart control.
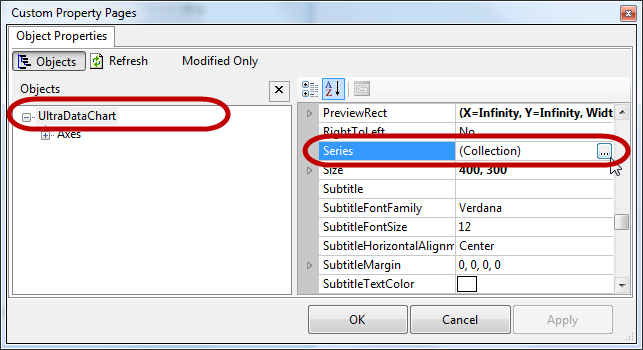
Next to the Series property, click the ellipse (…) button to open a dialog editor. In this Series Collection Editor, you can add series objects to the chart control.
The Series Collection Editor contains an "Add" button allowing you to select series type from the list. Select a AreaSeries to visualize data and then click OK to add the series to Series collection of the chart control
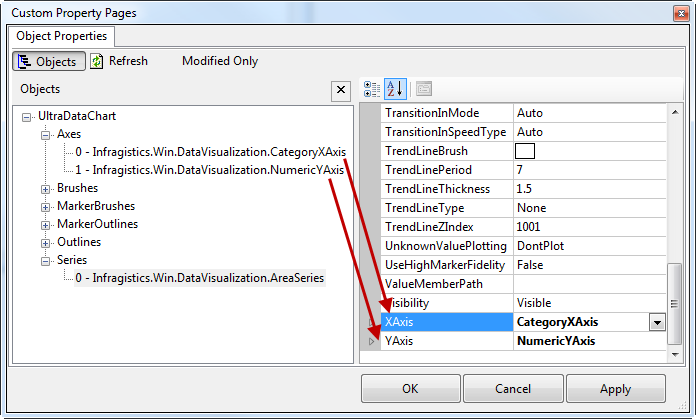
Set XAxis and YAxis properties of the AreaSeries to the names of axes that you created in previous section.
Copy sample data code from the Sample Energy Data resource to your project and create an instance of category sample data:
In C#:
var data = new CategorySampleData();In Visual Basic:
Dim data As New CategorySampleData()Binding data requires configuration of the DataSource property exposed on a Series object, and on an Axis object of category type. The numeric axis objects do not have DataSource property and labels of this axis are automatically generated based on range of data bound to the series.
The following code example shows DataSource binding on the CategoryXAxis object as well as how to map labels of the axis to the Label data column.
In C#:
var xAxis = this.ultraDataChart1.Axes.OfType<CategoryXAxis>().FirstOrDefault();
xAxis.Label = "Country";
xAxis.DataSource = data;
In Visual Basic:
Dim xAxis = Me.ultraDataChart1.Axes.OfType(Of CategoryXAxis)().FirstOrDefault()
xAxis.Label = "Country"
xAxis.DataSource = data
The following example shows DataSource binding on AreaSeries object as well as how to map values of the series to the Value data column.
In C#:
var series = this.ultraDataChart1.Series.OfType<AreaSeries>().FirstOrDefault();
series.ValueMemberPath = "Coal";
series.DataSource = data;
In Visual Basic:
 Dim series = Me.ultraDataChart1.Series.OfType(Of AreaSeries)().FirstOrDefault()
series.ValueMemberPath = "Coal"
series.DataSource = dataThe following topics provide additional information related to this topic.