
This topic provides information on how to use the ScatterAreaSeries element in the UltraDataChart™ control.
This topic contains the following sections:
In the UltraDataChart control, the ScatterAreaSeries draws a colored surface based on a triangulation of X and Y data with a numeric value assigned to each point.
This type of series is useful for rendering heat maps, magnetic field strength or wifi strength in an office. The ScatterAreaSeries works a lot like the ScatterContourSeries except that it represents data as interpolated and colored surface instead of contour lines connecting data points with the same values.
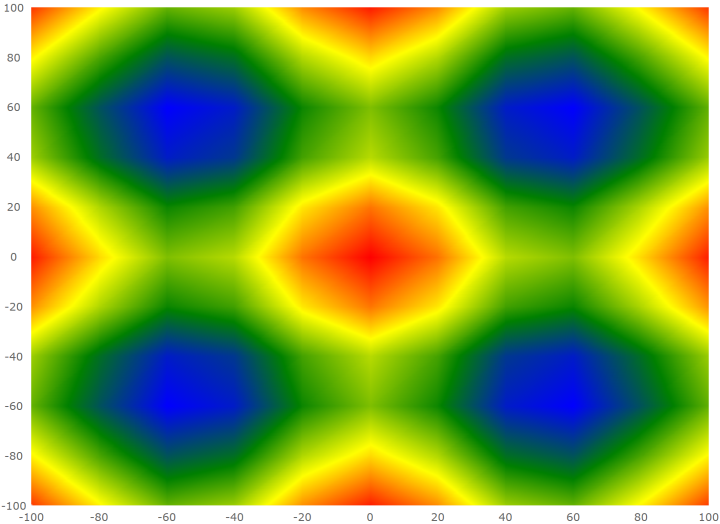
The following is a preview of the UltraDataChart control with a ScatterAreaSeries that is plotting 3D surface data where the Z axis is rendered as color changes across the surface. Lower Z values are in blue and higher values are in red.
Similar to other types of series in the UltraDataChart control, the ScatterAreaSeries has the DataSource property for the purpose of data binding. This property can be bound to an object that implements the IEnumerable interface (e.g. List, Collection, Queue, Stack). In addition, each item in this object must have two data columns that stores point locations (one for X and one for Y). These data columns are then mapped to the XMemberPath and YMemberPath properties. The data must also have one data column that stores a value for each point. This value is used by the ScatterAreaSeries to color the surface. This value column is mapped to the ColorMemberPath property.
The ScatterAreaSeries automatically performs built-in data triangulation on items in the DataSource if no triangulation is set to the TrianglesSource property. However, computing triangulation can be a very time-consuming process, so the runtime performance will be better when specifying a TriangulationSource for this property, especially when a large number of data items are present.
The following table summarizes required properties of ScatterAreaSeries used for data binding.
The following table summarizes optional properties of ScatterContourSeries used for data binding.
Use the ColorScale property of the ScatterAreaSeries to resolve values of points and thus fill the surface of the series. The colors are smoothly interpolated around the shape of the surface by applying a pixel-wise triangle rasterizer to triangulation data. Because rendering of the surface is pixel-wise, the color scale uses colors instead of brushes.
The provided CustomPaletteColorScale class should satisfy most coloring needs, but the ColorScale base class can be inherited by the application for custom coloring logic.
The following table list properties of the CustomPaletteColorScale affecting surface coloring of the ScatterAreaSeries.
The following code shows how to bind the ScatterAreaSeries 3D surface data in order to produce the above screenshot. You can find the 3D surface data used in the below example here.
In Visual Basic:
' ScatterAreaSeries requires numeric X and Y axis
Dim xAxis = New NumericXAxis()
Dim yAxis = New NumericYAxis()
Me.dataChart.Axes.Add(xAxis)
Me.dataChart.Axes.Add(yAxis)

' create and set data binding to the ScatterAreaSeries
Dim series = New ScatterAreaSeries()
series.DataSource = New CosXPlusCosY()
series.XMemberPath = "X"
series.YMemberPath = "Y"
series.ColorMemberPath = "Z"
series.XAxis = xAxis
series.YAxis = yAxis

' set a color scale
Dim colorScale = New CustomPaletteColorScale()
colorScale.InterpolationMode = ColorScaleInterpolationMode.InterpolateRGB
colorScale.Palette.Add(Color.Blue)
colorScale.Palette.Add(Color.Green)
colorScale.Palette.Add(Color.Yellow)
colorScale.Palette.Add(Color.Red)
series.ColorScale = colorScale

' add the ScatterAreaSeries to the UltraDataChart
Me.dataChart.Series.Add(series)
In C#:
// ScatterAreaSeries requires numeric X and Y axis
var xAxis = new NumericXAxis();
var yAxis = new NumericYAxis();
this.dataChart.Axes.Add(xAxis);
this.dataChart.Axes.Add(yAxis);

// create and set data binding to the ScatterAreaSeries
var series = new ScatterAreaSeries();
series.DataSource = new CosXPlusCosY();
series.XMemberPath = "X";
series.YMemberPath = "Y";
series.ColorMemberPath = "Z";
series.XAxis = xAxis;
series.YAxis = yAxis;

// set a color scale
var colorScale = new CustomPaletteColorScale();
colorScale.InterpolationMode = ColorScaleInterpolationMode.InterpolateRGB;
colorScale.Palette.Add(Color.Blue);
colorScale.Palette.Add(Color.Green);
colorScale.Palette.Add(Color.Yellow);
colorScale.Palette.Add(Color.Red);
series.ColorScale = colorScale;

// add the ScatterAreaSeries to the UltraDataChart
this.dataChart.Series.Add(series);The following topics provide additional information related to this topic.