
This topic provides information on how to use the ScatterContourSeries element in the UltraDataChart™ control.
This topic contains the following sections:
In the UltraDataChart control, the ScatterContourSeries draws colored contour lines based on a triangulation of X and Y data with a numeric value assigned to each point.
This type of series is useful for rendering heat maps, magnetic field strength or wifi strength in an office. The ScatterContourSeries works a lot like the ScatterAreaSeries except that it represents data as contour lines colored using a fill scale and the scatter area series represents data as a surface interpolated using a color scale.
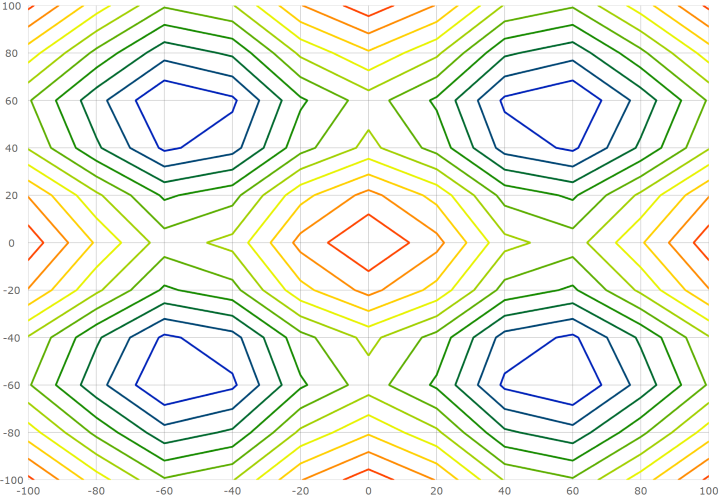
The following is a preview of the UltraDataChart control with a ScatterContourSeries that is plotting 3D surface data where the Z axis is rendered as color changes across the surface. Lower Z values are in blue and higher values are in red.
Similar to other types of series in the UltraDataChart control, the ScatterContourSeries has the DataSource property for the purpose of data binding. This property can be bound to an object that implements the IEnumerable interface (e.g. List, Collection, Queue, Stack). In addition, each item in this object must have two data columns that stores point locations (one for X and one for Y). These data columns are then mapped to the XMemberPath and YMemberPath properties. The data must also have one data column that stores a value for each point. This value is used by the ScatterContourSeries to color the surface. This value column is mapped to the ValueMemberPath property.
The ScatterContourSeries automatically performs built-in data triangulation on items in the DataSource if no triangulation is set to the TrianglesSource property. However, computing triangulation can be a very time-consuming process, so the runtime performance will be better when specifying a TriangulationSource for this property, especially when a large number of data items are present.
The following table summarizes required properties of ScatterContourSeries used for data binding.
The following table summarizes optional properties of ScatterContourSeries used for data binding.
Use the FillScale property of the ScatterContourSeries to resolve fill brushes of the contour lines.
The provided ValueBrushScale class should satisfy most of your coloring needs, but for applications that require custom coloring logic you can inherit the ValueBrushScale class.
The following table lists properties of the ValueBrushScale affecting the surface coloring of the ScatterContourSeries.
The ScatterContourSeries renders using exactly 10 contour lines at even intervals between the minimum and maximum values of the items mapped to the ValueMemberPath property. If you desire more or fewer contours, you can assign the LinearContourValueResolver with a number of contours to the ValueResolver property of the ScatterContourSeries.
The following code shows how to configure the number of contour lines in the ScatterContourSeries.
In C#:
var valueResolver = new LinearContourValueResolver();
valueResolver.ValueCount = 5;
scatterContourSeries1.ValueResolver = valueResolver;
In Visual Basic:
Dim valueResolver As New LinearContourValueResolver()
valueResolver.ValueCount = 5
scatterContourSeries1.ValueResolver = valueResolver
To determine the position of contour lines in an application, implement a custom value resolver. This is accomplished by inheriting from the ContourValueResolver and overriding the GetContourValues method.
The following code shows implementation of a custom contour value resolver that specifies contour lines at predefined positions.
In C#:
public class CustomValueResolver : Infragistics.Controls.Charts.ContourValueResolver
{
    public override IEnumerable<double> GetContourValues(IFastItemColumn<double> valueColumn)
    {
        return new double[] {1, 2, 4, 5, 8};
    }
}
In Visual Basic:
Public Class CustomValueResolver
    Inherits Infragistics.Controls.Charts.ContourValueResolver
    Overrides Function GetContourValues(valueColumn As IFastItemColumn(Of Double)) As IEnumerable(Of Double)
        Return New Double() { 1, 2, 4, 5, 8 }
    End Function
End ClassThe following code shows how to bind the ScatterContourSeries 3D surface data in order to produce the above screenshot. You can find the 3D surface data used in the below example here.
In Visual Basic:
' ScatterContourSeries requires numeric X and Y axis
Dim xAxis As New NumericXAxis()
Dim yAxis As New NumericYAxis()
Me.dataChart.Axes.Add(xAxis)
Me.dataChart.Axes.Add(yAxis)

' create and set data binding to the ScatterContourSeries
Dim series As New ScatterContourSeries()
series.DataSource = New CosXPlusCosY()
series.XMemberPath = "X"
series.YMemberPath = "Y"
series.ValueMemberPath = "Z"
series.XAxis = xAxis
series.YAxis = yAxis

' set a color scale
Dim brushScale As New ValueBrushScale()
brushScale.Brushes.Add(new SolidColorBrush(Color.Blue))
brushScale.Brushes.Add(new SolidColorBrush(Color.Green))
brushScale.Brushes.Add(new SolidColorBrush(Color.Yellow))
brushScale.Brushes.Add(new SolidColorBrush(Color.Red))
series.FillScale = brushScale

' add the ScatterContourSeries to the UltraDataChart
Me.dataChart.Series.Add(series)
In C#:
// ScatterContourSeries requires numeric X and Y axis
var xAxis = new NumericXAxis();
var yAxis = new NumericYAxis();
this.dataChart.Axes.Add(xAxis);
this.dataChart.Axes.Add(yAxis);

// create and set data binding to the ScatterContourSeries;
var series = new ScatterContourSeries();
series.DataSource = New CosXPlusCosY();
series.XMemberPath = "X";
series.YMemberPath = "Y";
series.ValueMemberPath = "Z";
series.XAxis = xAxis;
series.YAxis = yAxis;

// set a color scale
var brushScale = new ValueBrushScale();
brushScale.Brushes.Add(new SolidColorBrush(Color.Blue));
brushScale.Brushes.Add(new SolidColorBrush(Color.Green));
brushScale.Brushes.Add(new SolidColorBrush(Color.Yellow));
brushScale.Brushes.Add(new SolidColorBrush(Color.Red));
series.FillScale = brushScale;

// add the ScatterContourSeries to the UltraDataChart
this.dataChart.Series.Add(series);The following topics provide additional information related to this topic.