
This topic provides information on how to use the ScatterPolylineSeries element in the UltraDataChart™ control.
This topic contains the following sections:
In the UltraDataChart control, the ScatterPolylineSeries is a series that displays data using polylines. This type of scatter series is often used where rendering disconnected lines are required such as a network graph. The ScatterPolylineSeries works a lot like the ScatterPolygonSeries except that data is rendered with polylines instead of polygons.
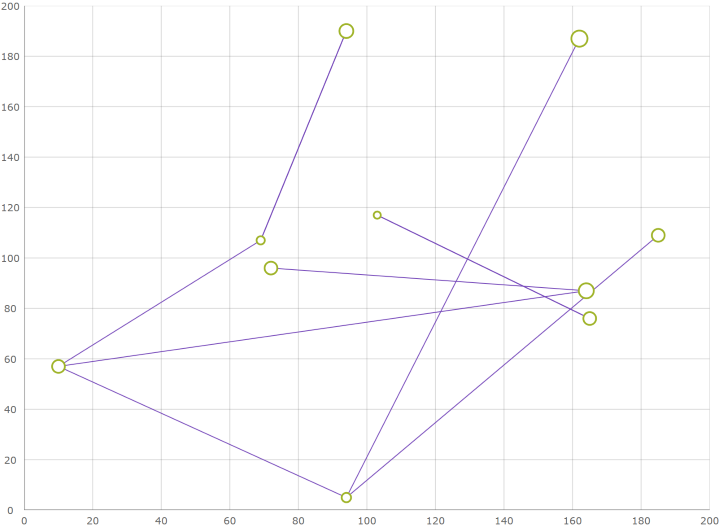
The following is a preview of the UltraDataChart control with the ScatterPolylineSeries rendering connections between various points.
Similar to other types of series in the UltraDataChart control, the ScatterPolylineSeries has the DataSource property for the purpose of data binding. This property can be bound to an object that implements the IEnumerable interface (e.g. List, Collection, Queue, Stack). In addition, each item in this object must have one data column that stores point locations (X and Y values) of connected items using IEnumerable<IEnumerable<Infragistics.Win.DataVisualization.Point>> structure. This data column is then mapped to the ShapeMemberPath property. The ScatterPolylineSeries uses the points of this mapped data column to plot polyines in the control.
In the above screenshot the structure of the data looks like this:
In C#:
public class Node
{
    // The lines that branch off this node to other nodes.
    public List<List<Point>> Points { get; set; }
}
In Visual Basic:
Public Class Node
    ' The lines that branch off this node to other nodes.
    Private _points As List(Of List(Of Point))
    public Property List(Of List(Of Point)) Points
        Get
            Return _points
        End Get
        Set
            _points = value
        End Set
    End Property
End Class
The following code shows how to bind the ScatterPolylineSeries to data.
In Visual Basic:
' ScatterPolylineSeries requires numeric X and Y axis
Dim xAxis = New NumericXAxis()
Dim yAxis = New NumericYAxis()
Me.dataChart.Axes.Add(xAxis)
Me.dataChart.Axes.Add(yAxis)

' create and set data binding to the ScatterPolylineSeries
Dim polylineSeries = New ScatterPolylineSeries()
polylineSeries.DataSource = Nodes
polylineSeries.ShapeMemberPath = "Points"
polylineSeries.XAxis = xAxis
polylineSeries.YAxis = yAxis

' add the ScatterPolylineSeries to the the UltraDataChart
Me.dataChart.Series.Add(polylineSeries)
In C#:
// ScatterPolylineSeries requires numeric X and Y axis
var xAxis = new NumericXAxis();
var yAxis = new NumericYAxis();
this.dataChart.Axes.Add(xAxis);
this.dataChart.Axes.Add(yAxis);

// create and set data binding to the ScatterPolylineSeries
var polylineSeries = new ScatterPolylineSeries();
polylineSeries.DataSource = Nodes;
polylineSeries.ShapeMemberPath = "Points";
polylineSeries.XAxis = xAxis;
polylineSeries.YAxis = yAxis;

// add the ScatterPolylineSeries to the the UltraDataChart
this.dataChart.Series.Add(polyLineSeries);The following topics provide additional information related to this topic.