
This topic provides conceptual information to all types of Scatter Series in the UltraDataChart™ control.
This topic contains the following sections:
In the UltraDataChart control, Scatter Series is a group of series that show markers to represent the relationship among items in several distinct series of data or to plot data items using x and y coordinates. The x and y coordinates of the data point are determined by two numeric data columns. The Scatter Series draw attention to uneven intervals or clusters of data. These types of series are often used to plot scientific data, and can highlight the deviation of collected data from predicted results. Scatter series can also be used to organize data chronologically (even if the data is not in chronological order).
The UltraDataChart control provides the following types of Scatter Series and each of them is discussed in an individual topic:
Refer to above topics to learn how to create a specific type of Scatter Series and bind data to it.
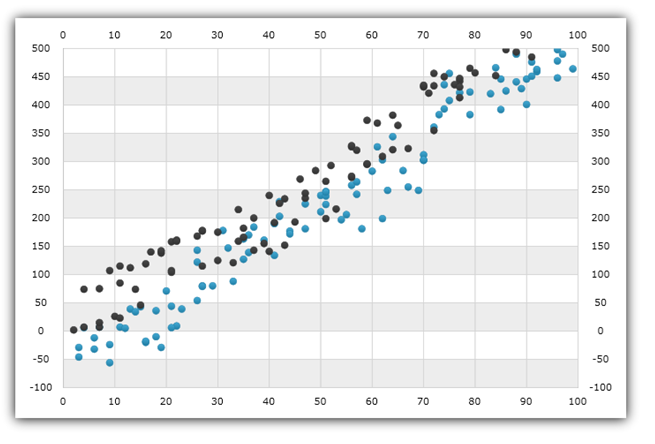
Figure 1: Sample implementation of Scatter Point Series
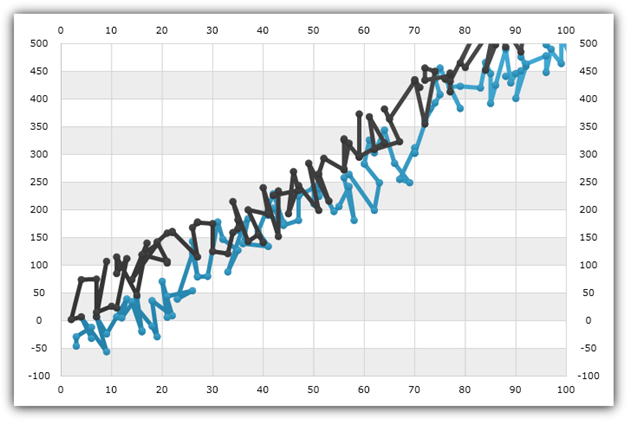
Figure 2: Sample implementation of Scatter Line Series
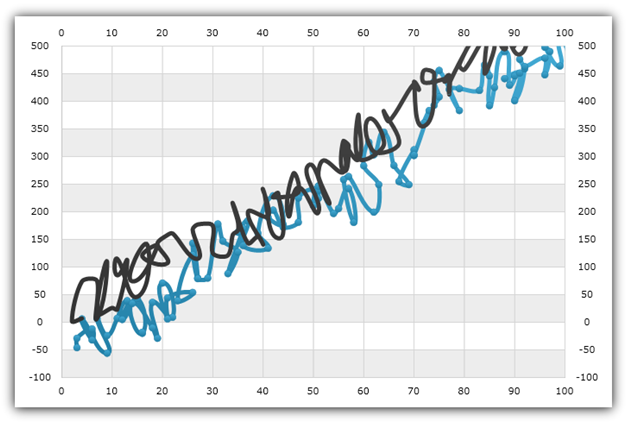
Figure 3: Sample implementation of Scatter Spline Series
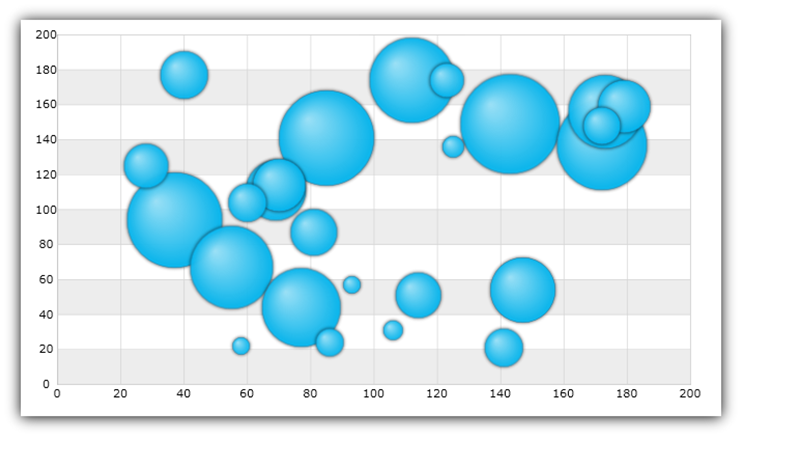
Figure 4: Sample implementation of Scatter Bubble Series
The UltraDataChart control provides various types of axes but only two types of axes can be used with all types of Scatter Series. The following table lists these supported axes:
In the Cartesian coordinate system, the location of data points is determined by a numeric value of an X-coordinate on the NumericXAxis and a numeric value of a Y-coordinate on the NumericYAxis. These coordinates are measured in the same unit of length, and they range from negative infinity to positive infinity. In addition, the origin of the Cartesian coordinate system or the location where the horizontal axis intersects with the vertical axis can be changed using the CrossingAxis and CrossingValue properties. For more detailed information on using these properties, please refer to the Axis Crossing topic.
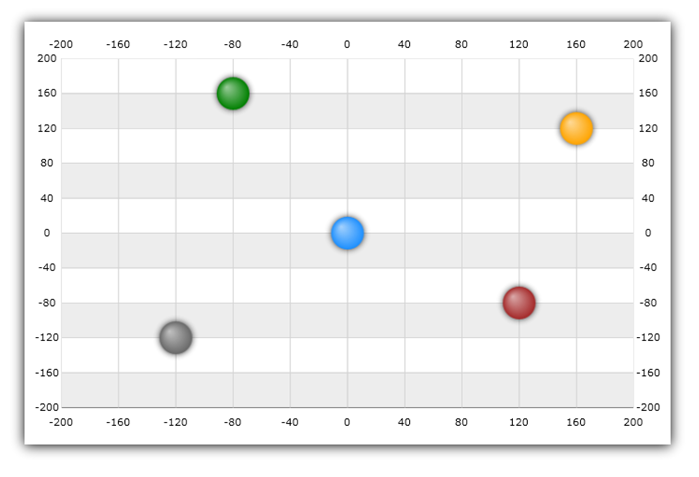
The following image shows the ScatterSeries with five data points at various locations in the Cartesian coordinate system:
The blue point is located in the center of the chart (0,0 – the origin of the coordinate system);
The red point with an X-coordinate of 120 and a Y-coordinate of minus 80 (120, -80);
The green point with an X-coordinate of minus 80 and a Y-coordinate of 160 (-80, 160);
The orange point with an X-coordinate of 160 and a Y-coordinate of 120 (160, 120); and
The gray point with an X-coordinate of minus 120 and a Y-coordinate of minus 120 (-120, -120).
This section provides information about binding data for all types of Scatter Series from data requirements through data sample to binding diagrams.
Similarly to other types of series in the UltraDataChart control, Scatter Series also use DataSource property to bind data. The following is a list of data requirements for Scatter Series:
The data model must contain at least one numeric data column (e.g. XValue) which is mapped using the XMemberPath property of Scatter series.
The data model must contain at least second numeric data column (e.g. YValue) which is mapped using the YMemberPath property of Scatter series.
The data source must contain at least one data items otherwise the chart will not render the Scatter series.
The data source must implement the IEnumerable interface (e.g. List, Collection, Queue, or Stack)
For more information on the requirements for the specific types of series, refer to the Series Requirements topic.
An example of object that meets above criteria is the PolarDataSource which you can download and use it in your project.