
This topic explains, with code examples, how to use the ScatterPointSeries in the UltraDataChart™ control. Some important conceptual information is provided as well.
This topic contains the following sections:
The ScatterSplineSeries belongs to a family of Scatter Series that use the Cartesian (x, y) coordinate system to plot data. This series displays the data as a collection of points connected with spline, each having a pair of numeric X/Y values that determines its location in the Cartesian coordinate system.
Scatter Series draw attention to uneven intervals or clusters of data. They can highlight the deviation of collected data from predicted results and they are often used to plot scientific and statistical data. The ScatterSplineSeries organizes and plots data chronologically (even if the data is not in chronological order before binding) on X-Axis and Y-Axis. The following sections list important conceptual and task-based information on how to use the ScatterSplineSeries and its features.
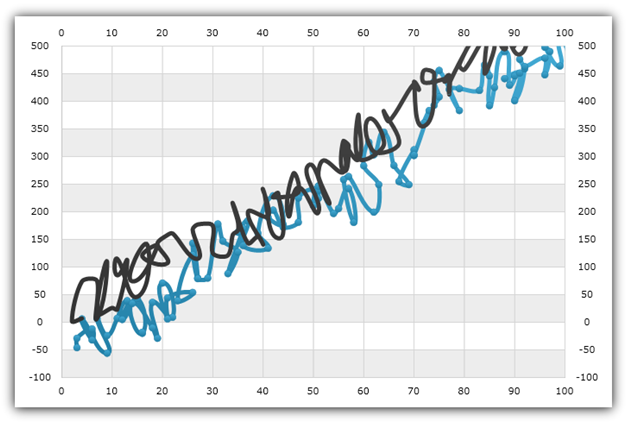
Figure 1: Sample implementation of the ScatterSplineSeries
The ScatterLineSeries has the following properties that you can use to customize appearance:
The ScatterSplineSeries uses the DataSource property to bind any data object that implements the IEnumerable interface (e.g. List, Collection, Queue, Stack). However, each data item in this object must have two numeric data columns (for X and Y values to position a bubble in the Cartesian coordinate system). These data columns are mapped using XMemberPath and YMemberPath properties.
An example of object that meets the criteria listed above is the BubbleDataSource which you can download use it in your project.
This code snippet below demonstrates how to bind sample bubble data to the ScatterSplineSeries.
In C#:
var data = new BubbleDataSource();
var xAxis = new NumericXAxis();
var yAxis = new NumericYAxis();

var series = new ScatterSplineSeries();
series.XAxis = xAxis;
series.YAxis = yAxis;
series.XMemberPath = "X";
series.YMemberPath = "Y";
series.DataSource = data;
DataChart.Axes.Add(xAxis);
DataChart.Axes.Add(yAxis);
DataChart.Series.Add(series);
In Visual Basic:
Dim data As New BubbleDataSource()
Dim xAxis As New NumericXAxis()
Dim yAxis As New NumericYAxis()

Dim series As New ScatterSplineSeries()
series.DataSource = data
series.XMemberPath = "X"
series.YMemberPath = "Y"
series.XAxis = xAxis
series.YAxis = yAxis
Dim chart As New UltraDataChart()
chart.Axes.Add(xAxis)
chart.Axes.Add(yAxis)
chart.Series.Add(series)The ScatterSplineSeries supports the ability to apply a dashed line via a dash array. You can do this by setting the DashArray property of the series to a new DoubleCollection with the double[] describing the dash lengths that you wish to see. The following code examples demonstrate how to do this:
In C#:
var series = new ScatterSplineSeries();
series.DashArray = new DoubleCollection(new double[] { 5, 5 });
In Visual Basic:
Dim series = New ScatterSplineSeries()
series.DashArray = New DoubleCollection(New Double() {5, 5})