
This topic introduces the Value Overlay feature of the UltraDataChart™ control and explains, with code examples, how to display value overlays.
The topic is organized as follows:
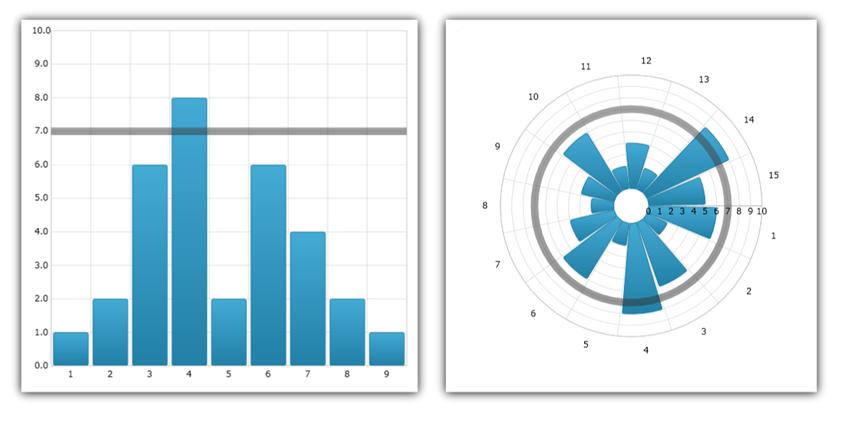
In the UltraDataChart™ control, ValueOverlay is used to overlay a single numeric value as a line over other types of series in order to indicate important values such as mean/median of a data set. Unlike other types of series, which use DataSource property for data binding, ValueOverlay uses the Value property to bind a numeric value. In addition, ValueOverlay uses only one Axis as reference. ValueOverlay is a horizontal or vertical line when bound to NumericXAxis and NumericYAxis respectively, a line starting from the center of the chart when bound to NumericAngleAxis or a circle when bound to NumericRadiusAxis.
In the UltraDataChart, you are able to add annotations to your axes to show particular values at different points on that axis. This can help you to visualize things such as final series values, overlay values, and values corresponding to crosshairs in the chart.
You can enable the axis annotations by setting the isAxisAnnotationEnabled property of the corresponding overlay to true. In doing so, this will place a box on the corresponding owning axis or axes with the value that that particular overlay or layer represents at the point that it is currently at.
You can customize the axis annotations in background, value precision, outline, padding, stroke (outline) thickness, and text color. These can be set using the AxisAnnotationBackground, AxisAnnotationInterpolatedValuePrecision, AxisAnnotationOutline, AxisAnnotationStrokeThickness, and AxisAnnotationTextColor properties, respectively. In addition to these properties, there is also an AxisAnnotationFormatLabel event that you can use to fully customize what exactly is shown in axis annotations.
This code snippet demonstrates how to add axis annotations to the ValueOverlay in the Data Chart control.
In Visual Basic:
Dim overlay As New ValueOverlay()
overlay.Axis = Me.numericYAxis
overlay.Value = 7.0
overlay.IsAxisAnnotationEnabled = true
Me.DataChart.Series.Add(overlay)
In C#:
var overlay = new ValueOverlay();
overlay.Axis = this.numericYAxis;
overlay.Value = 7.0;
overlay.IsAxisAnnotationEnabled = true;
this.DataChart.Series.Add(overlay);
The following sections will show you how to bind various items to the ValueOverlay.
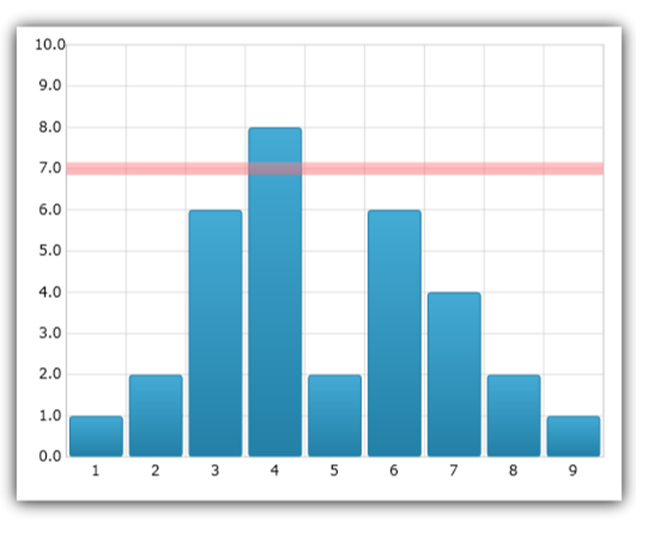
This code snippet demonstrates how to bind a fixed value to the ValueOverlay in the Data Chart control.
In Visual Basic:
Dim overlay As New ValueOverlay()
overlay.Axis = Me.numericYAxis
overlay.Value = 7.0
Me.DataChart.Series.Add(overlay)
In C#:
var overlay = new ValueOverlay();
overlay.Axis = this.numericYAxis;
overlay.Value = 7.0;
this.DataChart.Series.Add(overlay);
The following image shows ValueOverlay with binding to the value of 7 and overlaid over column series in the Data Chart.
In C#:
var meanCalculator = new MeanCalculator();
meanCalculator.ValueMemberPath = "Y";
meanCalculator.ItemsSource = new NumericDataSample();
var overlay = new ValueOverlay();
overlay.Axis = numericYAxis;
overlay.Value = meanCalculator.Value;
DataChart.Series.Add(overlay);