var dataChart = new UltraDataChart();
var percentYAxis = new PercentChangeYAxis();
dataChart.Axes.Add(percentYAxis);
This topic demonstrates, with code examples, how to use the PercentChangeYAxis in the UltraDataChart control. This axis allows the ability to show percent values as opposed to the actual bound values to the chart.
The following topics are prerequisites to understanding this topic:
The PercentChangeYAxis may be used with the following series types:
The PercentChangeYAxis works such that it takes the first data point in your series as a reference value. Each value after the first value is scaled according to what percent increase or decrease it is compared to the reference value.
For CategorySeries, this reference value corresponds to the ValueMemberPath for those series.
For ScatterSeries, the reference value will correspond to the YMemberPath for those series.
For RangeSeries, the reference value will correspond to the first low value.
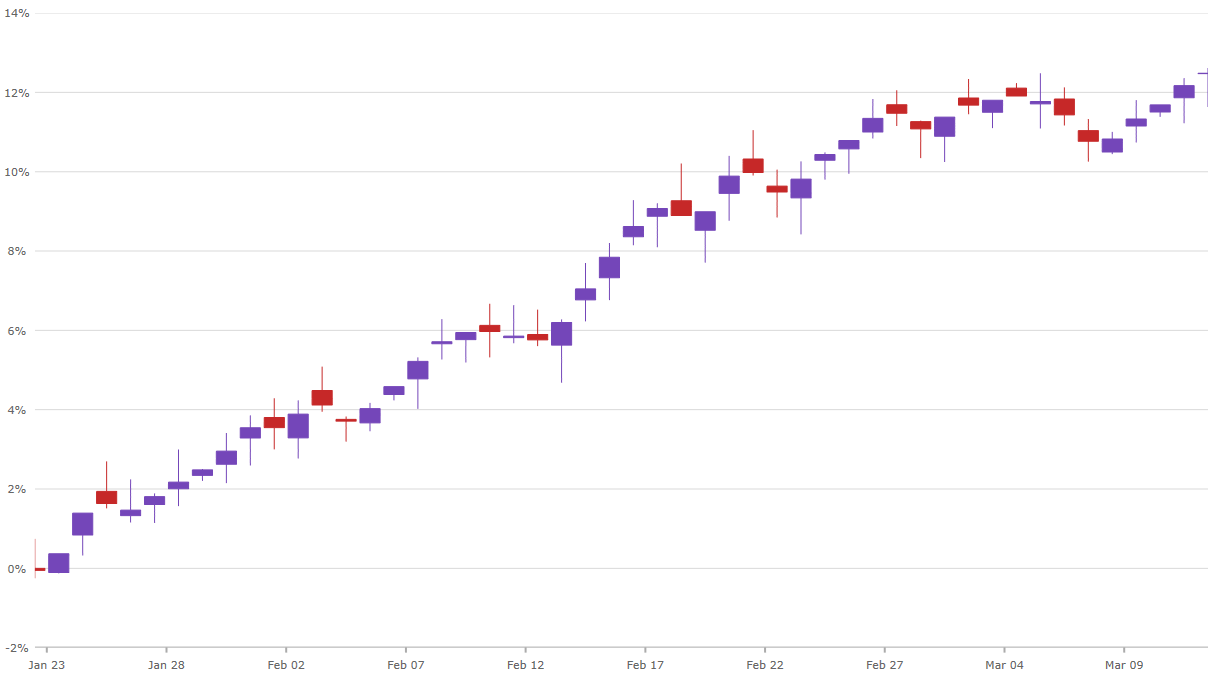
For FinancialSeries and Financial Indicators, the reference value will correspond to the first "Open" value.
The following code example demonstrates usage of the PercentChangeYAxis element in the UltraDataChart control.
In C#:
var dataChart = new UltraDataChart();
var percentYAxis = new PercentChangeYAxis();
dataChart.Axes.Add(percentYAxis);In VB.NET:
Dim dataChart As UltraDataChart = New UltraDataChart()
Dim percentYAxis As PercentChangeYAxis = New PercentChangeYAxis()
dataChart.Axes.Add(percentYAxis)
Below is a screenshot demonstrating the usage of the PercentChangeYAxis with a FinancialPriceSeries.