
This topic demonstrates, with code examples, how to use TimeXAxis in the UltraDataChart™ control. The benefit of using TimeXAxis is to dynamically change label formats as you zoom in or out of the data. In addition, axis breaks can be created which omit dates within a range. For example, weekends can be skipped.
The topic is organized as follows:
Note: The following sections are only required if the default labels (i.e. formatting & intervals) need to be changed.
The TimeXAxis may be used with the following series:
For more information on what axis types are required by a specific series, refer to the Series Requirements topic.
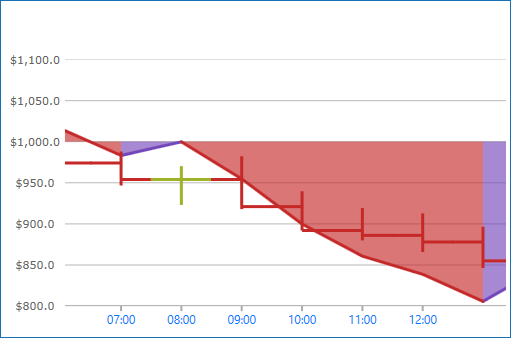
Figure 1: Sample implementation of the TimeXAxis
The TimeXAxis has the option to exclude intervals of data with Breaks. As a result, labels will not appear at the excluded interval. For example, working/non-working, holidays, and/or weekends.
An instance of TimeAxisBreak can be added to the Breaks property and configured by using a unique Start, End and Interval.
The following code snippets show how to skip labels on the TimeXAxis in the UltraDataChart for a range of years, causing uneven intervals. The result is shown in Figure 2 below.
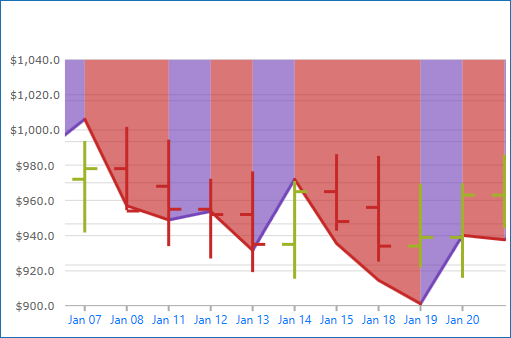
Figure 2: TimeXAxis displaying data from Monday through Friday in 2010.
In Visual Basic:
Dim axisBreaks = xAxis.Breaks

axisBreaks.Add(New TimeAxisBreak() With { _
	.Start = New DateTime(2009, 12, 26, 0, 0, 0), _
	.[End] = New DateTime(2009, 12, 27, 23, 59, 59), _
	.Interval = New TimeSpan(7, 0, 0, 0, 0) _
})
In C#:
var axisBreaks = xAxis.Breaks;

axisBreaks.Add(new TimeAxisBreak
{
    Start = new DateTime(2009, 12, 26, 00, 00, 00),
    End = new DateTime(2009, 07, 12, 27, 59, 59),
    Interval = new TimeSpan(7, 0, 0, 0, 0)
});The TimeXAxis has the LabelFormats property which is a collection of type TimeAxisLabelFormat. Each TimeAxisLabelFormat added to the collection is responsible for assigning a unique Format and Range. This can be especially useful for drilling data from years to milliseconds and adjusting the labels depending on the range of time shown by the chart.
The following lists a typical set of label formats for the given amount of time in view:
1825 days or more (eg. 5 years) will result in a format of "yyyy".
365 days or more (eg. 1 year) will result in a format of "MMM yy".
1 day or more will result in a format of "MMM dd".
5 hours or more will result in a format of "hh:mm".
Below 5 hours will result in a format of "hh:mm:ss".
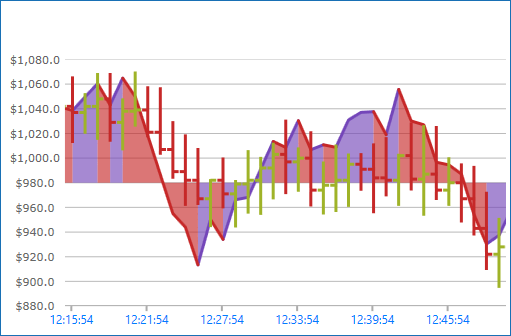
Figure 3: The UltraDataChart control with a custom TimeAxisLabelFormat of "hh:mm:ss"
In Visual Basic:
Dim DataChart = New UltraDataChart()
Dim timeXAxis = New TimeXAxis()
DataChart.Axes.Add(timeXAxis)

Dim axisFormat = xAxis.LabelFormats
axisFormat.Add(New TimeAxisLabelFormat() With { _
	.Format = "hh:mm:ss", _
	.Range = New TimeSpan(0, 0, 0, 0, 0) _
})

axisFormat.Add(New TimeAxisLabelFormat() With { _
	.Format = "hh:mm", _
	.Range = New TimeSpan(0, 5, 0, 0, 0) _
})

axisFormat.Add(New TimeAxisLabelFormat() With { _
	.Format = "MMM dd", _
	.Range = New TimeSpan(1, 0, 0, 0, 0) _
})

axisFormat.Add(New TimeAxisLabelFormat() With { _
	.Format = "MMM yy", _
	.Range = New TimeSpan(365, 0, 0, 0, 0) _
})

axisFormat.Add(New TimeAxisLabelFormat() With { _
	.Format = "yyyy", _
	.Range = New TimeSpan(1825, 0, 0, 0, 0) _
})
In C#:
var DataChart = new UltraDataChart();
var timeXAxis = new TimeXAxis();
DataChart.Axes.Add(timeXAxis);

var axisFormat = xAxis.LabelFormats;

axisFormat.Add(new TimeAxisLabelFormat
{
    Format = "hh:mm:ss",
    Range = new TimeSpan(0, 0, 0, 0, 0)
});

axisFormat.Add(new TimeAxisLabelFormat
{
    Format = "hh:mm",
    Range = new TimeSpan(0, 5, 0, 0, 0)
});

axisFormat.Add(new TimeAxisLabelFormat
{
    Format = "MMM dd",
    Range = new TimeSpan(1, 0, 0, 0, 0)
});

axisFormat.Add(new TimeAxisLabelFormat
{
    Format = "MMM yy",
    Range = new TimeSpan(365, 0, 0, 0, 0)
});

axisFormat.Add(new TimeAxisLabelFormat
{
    Format = "yyyy",
    Range = new TimeSpan(1825, 0, 0, 0, 0)
});The TimeXAxis replaces the conventional Interval property with an Intervals collection of type TimeAxisInterval. Each TimeAxisInterval added to the collection is responsible for assigning a unique Interval, Range and IntervalType. This can be especially useful for drilling data from years to milliseconds to provide unique spacing between labels depending on the range of time shown by the chart.
The following screenshot and code snippets demonstrate how to implement several TimeAxisInterval in the UltraDataChart control.
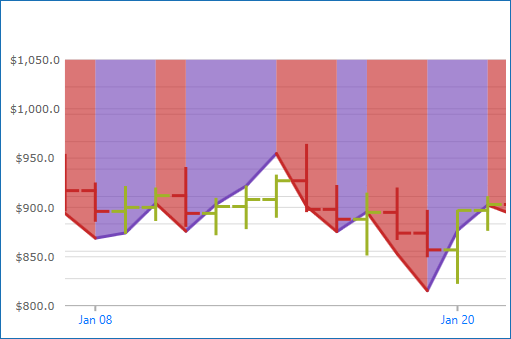
Figure 4: TimeXAxis using a TimeAxisInterval with an Interval of 12 days.
In Visual Basic:
Dim axisIntervals = xAxis.Intervals

axisIntervals.Add(New TimeAxisInterval() With { _
	.IntervalType = TimeAxisIntervalType.Seconds, _
	.Interval = 36, _
	.Range = New TimeSpan(0, 0, 0, 0, 0) _
})

axisIntervals.Add(New TimeAxisInterval() With { _
	.IntervalType = TimeAxisIntervalType.Minutes, _
	.Interval = 6, _
	.Range = New TimeSpan(0, 0, 30, 0, 0) _
})

axisIntervals.Add(New TimeAxisInterval() With { _
	.IntervalType = TimeAxisIntervalType.Hours, _
	.Interval = 1, _
	.Range = New TimeSpan(0, 5, 0, 0, 0) _
})

axisIntervals.Add(New TimeAxisInterval() With { _
	.IntervalType = TimeAxisIntervalType.Days, _
	.Interval = 12, _
	.Range = New TimeSpan(1, 0, 0, 0, 0) _
})

axisIntervals.Add(New TimeAxisInterval() With { _
	.IntervalType = TimeAxisIntervalType.Months, _
	.Interval = 1, _
	.Range = New TimeSpan(365, 0, 0, 0, 0) _
})

axisIntervals.Add(New TimeAxisInterval() With { _
	.IntervalType = TimeAxisIntervalType.Years, _
	.Interval = 2, _
	.Range = New TimeSpan(1825, 0, 0, 0, 0) _
})
In C#:
var axisIntervals = xAxis.Intervals;

axisIntervals.Add(new TimeAxisInterval
{
    IntervalType = TimeAxisIntervalType.Seconds,
    Interval = 36,
    Range = new TimeSpan(0, 0, 0, 0, 0)
});

axisIntervals.Add(new TimeAxisInterval
{
    IntervalType = TimeAxisIntervalType.Minutes,
    Interval = 6,
    Range = new TimeSpan(0, 0, 30, 0, 0)
});

axisIntervals.Add(new TimeAxisInterval
{
    IntervalType = TimeAxisIntervalType.Hours,
    Interval = 1,
    Range = new TimeSpan(0, 5, 0, 0, 0)
});

axisIntervals.Add(new TimeAxisInterval
{
    IntervalType = TimeAxisIntervalType.Days,
    Interval = 12,
    Range = new TimeSpan(1, 0, 0, 0, 0)
});

axisIntervals.Add(new TimeAxisInterval
{
    IntervalType = TimeAxisIntervalType.Months,
    Interval = 1,
    Range = new TimeSpan(365, 0, 0, 0, 0)
});

axisIntervals.Add(new TimeAxisInterval
{
    IntervalType = TimeAxisIntervalType.Years,
    Interval = 2,
    Range = new TimeSpan(1825, 0, 0, 0, 0)
});