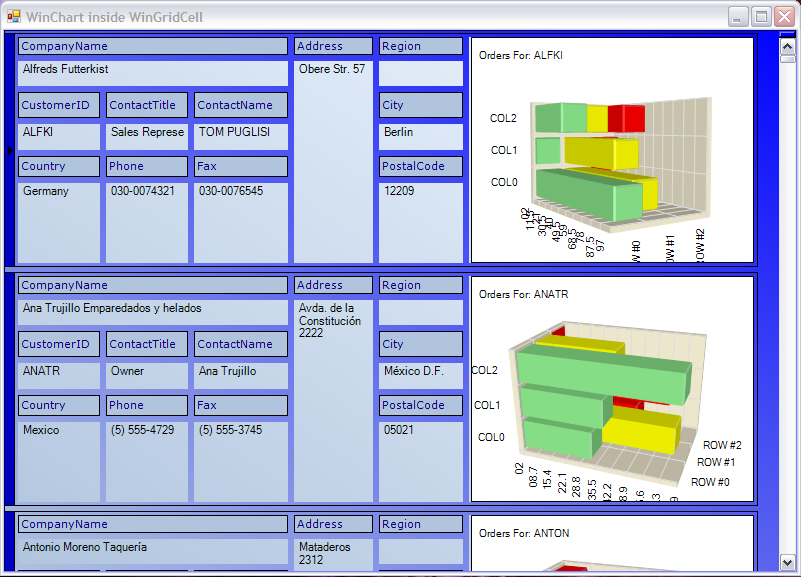

Sometimes displaying tabular Grid data can be greatly enhanced by also providing a Chart to show an entity’s trends. Achieving this kind of functionality with WinGrid™ and WinChart™ requires custom coding that requires a good understanding of the IUIElementDrawFilter interface as well as some creativity. The following series of topics describe the design and philosophy behind an example that does indeed achieve this functionality.
In order to understand the various aspects of achieving this functionality, the following topics have been designed to explain each part of the working sample.
How to show WinChart inside WinGrid cells – This topic describes any limitations of the involved controls and then proceeds to explain why a Draw Filter will be used to achieve this functionality.
The WinChart inside WinGrid Draw Filter Implementation – This topic explains the design of the Draw Filter that is used to show the Chart inside the WinGrid Cells.
The ChartInfoEventArgs Class – This topic explains the class that is used to expose Chart and Grid related information to end developers using the final product.
The ChartLayout Class – This topic explains the Class that is used to store the State of WinChart at any given moment in time.
Helper Functions – This topic describes the supporting methods that are used to store and load Chart State.
Using the WinChart inside WinGrid Draw Filter – This topic describes how the complete implementation is used by an end developer within a Windows Form.