
This topic demonstrates how to bind data to the UltraPieChart™ control. At the end of the topic, a complete code sample is provided.
The topic is organized as follows:
The procedure below demonstrates how to bind the UltraPieChart control to a data collection.
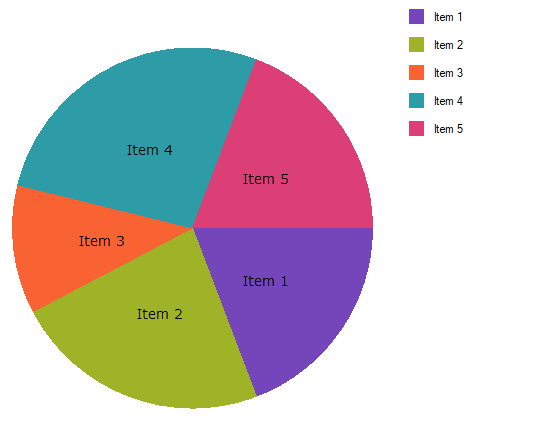
Figure 1: The UltraPieChart control as implemented by the sample code
Add the following Infragistics assemblies to your main project:
Infragistics.Win.DataVisualization.UltraDataChart.dll
Infragistics.Win.DataVisualization.Shared.dll
Infragistics.Win.Portable.Core.dll
Also, add the following Infragistics namespaces:
In C#:
using Infragistics.Win.DataVisualization;
using Infragistics.Win.DataVisualization.Shared;
using Infragistics.Win.Portable.Core;
In VB:
Imports Infragistics.Win.DataVisualization
Imports Infragistics.Win.DataVisualization.Shared
Imports Infragistics.Win.Portable.CoreDefining a Data Model
Adding an Instance of the Pie Chart control
(Optional) Verifying the result
Define a Data Model.
Create a class to model the data. The following code creates a DataItem class representing simple value-label pairs, as well as a Data class representing a collection of those pairs:
In C#:
    public class DataItem
    {
        public string Label { get; set; }
        public double Value { get; set; }
    }
    public class Data : ObservableCollection<DataItem>
    {
        public Data()
        {
            Add(new DataItem { Label = "Item 1", Value = 5 });
            Add(new DataItem { Label = "Item 2", Value = 6 });
            Add(new DataItem { Label = "Item 3", Value = 3 });
            Add(new DataItem { Label = "Item 4", Value = 7 });
            Add(new DataItem { Label = "Item 5", Value = 5 });
        }
    }
In Visual Basic:
Public Class DataItem
   Public Property Label() As String
      Get
         Return _Label
       End Get
       Set
          _Label = Value
       End Set
    End Property
    Private _Label As String
    Public Property Value() As Double
       Get
          Return _Value
       End Get
       Set
          _Value = Value
       End Set
    End Property
    Private _Value As Double
End Class
Public Class Data
   Inherits ObservableCollection(Of DataItem)
   Public Sub New()
      Add(New DataItem() With { .Label = "Item 1", .Value = 5 })
      Add(New DataItem() With { .Label = "Item 2", .Value = 6 })
      Add(New DataItem() With { .Label = "Item 3", .Value = 3 })
      Add(New DataItem() With { .Label = "Item 4", .Value = 7 })
      Add(New DataItem() With { .Label = "Item 5", .Value = 5 })
   End Sub
 End Class
Add an instance of the UltraPieChart Control.
To the form, add an instance of the data collection, a legend instance, and an instance of the Pie Chart:
In C#:
UltraPieChart pieChart = new UltraPieChart();
this.Controls.Add(pieChart);
pieChart.Dock = DockStyle.Fill;
pieChart.LabelMemberPath = "Label";
pieChart.ValueMemberPath = "Value";
pieChart.DataSource = new Data();
UltraItemLegend legend = new UltraItemLegend();
this.Controls.Add(legend);
legend.Dock = DockStyle.Right;
legend.Height = 500;
pieChart.Legend = legend;
legend.BringToFront();
In VB:
Dim pieChart As New UltraPieChart ()
Me.Controls.Add(pieChart)
pieChart.Dock = DockStyle.Fill
pieChart.LabelMemberPath = "Label"
pieChart.ValueMemberPath = "Value"
pieChart.DataSource = New Data ()
Dim legend As New UltraItemLegend()
legend.Dock = DockStyle.Right
legend.Height = 500
pieChart.Legend = legend
legend.BringToFront()
(Optional) Verify the Result.
Run your application to verify the result. If you have successfully bound the Pie Chart control to the data collection, the resulting chart will look like the one shown in Figure 1, above.