

This topic demonstrates how to configure the Others category for the UltraPieChart™ control. At the end of the topic, the complete code sample is provided.
The topic is organized as follows:
Sometimes, the underlying data for the Pie Chart control will contain many items with small values. In this case, the Others category will permit automatic aggregation of several data values into a single slice.
Following is a preview of the final result:
Figure 1: A pie chart featuring the Others category as implemented by the sample code
This topic assumes you have already read the Data Binding topic, and uses the code therein as a starting point.
Defining a Data Model.
Configuring an instance of the Data class as the DataSource for a Pie Chart
Configuring the Others category
(Optional) Verifying the result
Define a Data Model .
Define a simple data model called DataItem. Then, define a Data collection containing several DataItems of relatively small value:
In C#:
    public class DataItem
    {
        public string Label { get; set; }
        public double Value { get; set; }
    }
    public class Data : ObservableCollection<DataItem>
    {
        public Data()
        {
            Add(new DataItem { Label = "Item 1", Value = 5 });
            Add(new DataItem { Label = "Item 2", Value = 6 });
            Add(new DataItem { Label = "Item 3", Value = 3 });
            Add(new DataItem { Label = "Item 4", Value = 7 });
            Add(new DataItem { Label = "Item 5", Value = 1 });
            Add(new DataItem { Label = "Item 6", Value = 1 });
            Add(new DataItem { Label = "Item 7", Value = 1 });
            Add(new DataItem { Label = "Item 8", Value = 1 });
            Add(new DataItem { Label = "Item 9", Value = 1 });
        }
    }
In Visual Basic:
Public Class DataItem
    Public Property Label() As String
        Get
            Return _Label
        End Get
        Set
            _Label = Value
        End Set
    End Property
    Private _Label As String
    Public Property Value() As Double
        Get
            Return _Value
        End Get
        Set
            _Value = Value
        End Set
    End Property
    Private _Value As Double
End Class
Public Class Data
    Inherits ObservableCollection(Of DataItem)
    Public Sub New()
        Add(New DataItem() With { .Label = "Item 1", .Value = 5  })
        Add(New DataItem() With { .Label = "Item 2", .Value = 6  })
        Add(New DataItem() With { .Label = "Item 3", .Value = 3  })
        Add(New DataItem() With { .Label = "Item 4", .Value = 7  })
        Add(New DataItem() With { .Label = "Item 5", .Value = 1  })
        Add(New DataItem() With { .Label = "Item 6", .Value = 1  })
        Add(New DataItem() With { .Label = "Item 7", .Value = 1  })
        Add(New DataItem() With { .Label = "Item 8", .Value = 1  })
        Add(New DataItem() With { .Label = "Item 9", .Value = 1  })
    End Sub
End Class
Configure an instance of the Data class as the DataSource for a Pie Chart .
In C#:
 public partial class Form1 : Form
    {
        public Form1()
        {
            InitializeComponent();
        }
        UltraPieChart pieChart;
        UltraLabel ultraLabel1;
        UltraItemLegend legend;
        private void Form1_Load(object sender, EventArgs e)
        {
            pieChart = new UltraPieChart
            {
                Dock = DockStyle.Left,
                LabelMemberPath = "Label",
                ValueMemberPath = "Value",
                DataSource = new Data(),
            };
            this.Controls.Add(pieChart);
            ultraLabel1 = new UltraLabel
            {
                Name = "ultraLabel1",
                Dock = DockStyle.Right,
                Text = ""
            };
            this.Controls.Add(ultraLabel1);
            this.ultraLabel1.BringToFront();
            legend = new UltraItemLegend
            {
                Dock = DockStyle.Right,
                Height = 500
            };
            this.Controls.Add(legend);
            this.pieChart.Legend = legend;
            this.legend.BringToFront();
 }
     }
In VB:
Partial Public Class Form1
    Inherits Form
    Public Sub New()
        InitializeComponent()
    End Sub
    Private pieChart As UltraPieChart
    Private ultraLabel1 As UltraLabel
    Private legend As UltraItemLegend
    Private Sub Form1_Load(sender As Object, e As EventArgs)
                pieChart = New UltraPieChart() With { _
                        .Dock = DockStyle.Left, _
                        .LabelMemberPath = "Label", _
                        .ValueMemberPath = "Value", _
                        .DataSource = New Data() _
                }
        Me.Controls.Add(pieChart)
                ultraLabel1 = New UltraLabel() With { _
                        .Name = "ultraLabel1", _
                        .Dock = DockStyle.Right, _
                        .Text = "" _
                }
        Me.Controls.Add(ultraLabel1)
        Me.ultraLabel1.BringToFront()
                legend = New UltraItemLegend() With { _
                        .Dock = DockStyle.Right, _
                        .Height = 500 _
                }
        Me.Controls.Add(legend)
        Me.pieChart.Legend = legend
        Me.legend.BringToFront()
    End Sub
End Class
The Pie Chart will now display as shown in Figure 2:
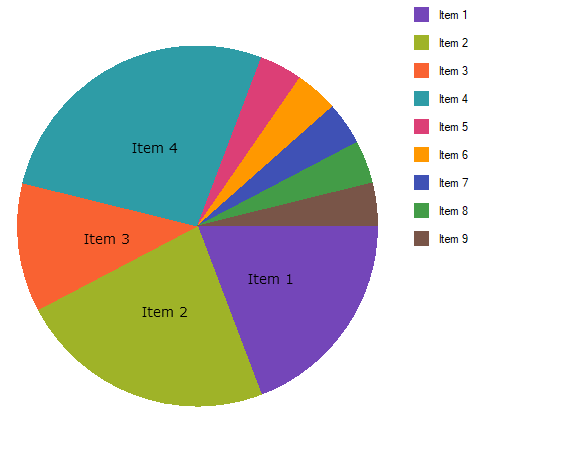
Figure 2: The pie chart, before configuring the Others category
Configure the Others category .
Items 5 through 9 are very small, giving the chart a cluttered appearance. Assign these items to the Others category using the OthersCategoryThreshold, OthersCategoryType, and OthersCategoryText properties on UltraPieChart:
In C#:
pieChart.OthersCategoryThreshold = 2;
pieChart.OthersCategoryType = OthersCategoryType.Number;
pieChart.OthersCategoryText = "Others";
In VB:
pieChart.OthersCategoryThreshold = 2
pieChart.OthersCategoryType = OthersCategoryType.Number
pieChart.OthersCategoryText = "Others"
Here, the OthersCategoryThreshold is set to 2, and OthersCategoryType is set to Number. Therefore, items with value less than or equal to 2 will be assigned to the “Others” category.
(Optional) Verify the result.
Run the application. The Pie Chart should now display as shown in Figure 1, above.