
This topic explains, with code examples, how to define a Normal Range in UltraSparkline™.
The following table lists the topics required as a prerequisite to understanding this topic.
This topic contains the following sections:
The Normal Range is a horizontal stripe representing some pre-defined meaningful range when the data is being visualized. The Normal Range can be set as a shaded area outlined with the desired color.
The Normal Range can be wider than the maximum data points or beyond. It can also be as thin as a line, to serve as threshold indicator for instance. You can also configure the width and the appearance (outline, fill, and color) of the Normal Range.
The minimum settings required for displaying the Normal Range are the visibility, the bottom border of the range, and the top border of range. These settings are managed, respectively, by the following properties :
By default, the Normal Range is not displayed.When enabled, the Normal Range shows with light gray color appearance.
The following table maps the tasks related to displaying markers to the property settings that configure them.
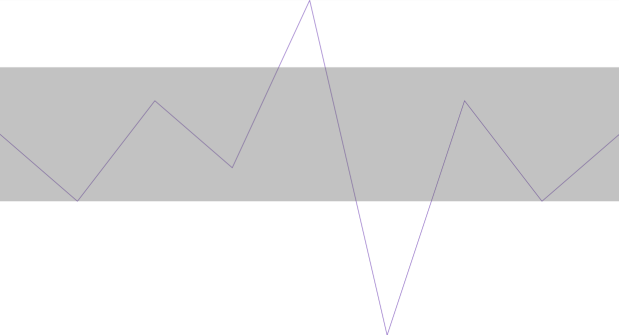
The screenshot below demonstrates how the Sparkline looks as a result of the following settings:
The Normal Range can be configured in the following aspects:
Visibility
Width ( defined by setting the top and bottom border settings, see Property settings . )
Fill color ( By default the range is filled with light gray . )
The following code uses the minimum of the property setting to display the normal range. The NormalRangeFill property is not required. It displays light-gray by default, as it is shown in the preview above, although it can be changed with desired color.
In C#:
this.UltraSparkline1.NormalRangeVisibility = Infragistics.Portable.Components.UI.Visibility.Visible;
this.UltraSparkline1.NormalRangeMaximum = 5;
this.UltraSparkline1.NormalRangeMinimum = 1;
In Visual Basic:
Me.UltraSparkline1.NormalRangeVisibility = Infragistics.Portable.Components.UI.Visibility.Visible
Me.UltraSparkline1.NormalRangeMaximum = 5
Me.UltraSparkline1.NormalRangeMinimum = 1The following topics provide additional information related to this topic.