
This topic demonstrates, with code examples, how to define the markers for UltraSparkline™ control.
The following table lists the topics required as a prerequisite to understanding this topic.
This topic contains the following sections:
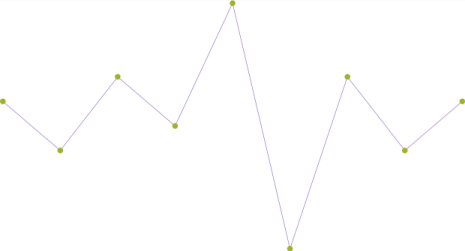
Markers are symbols (circular colored icons) overlaid on the Sparkline to indicate the individual data points based on X/Y coordinates. Markers can be set on Sparkline of types Line, Area and Column. The WinLoss type of Sparkline does not accept markers.
Markers can be displayed on the first, last, highest, lowest and negative data points and as any combination of these.
By default, markers are not displayed.
The following table maps the tasks related to displaying markers to the property settings that configure them.
Note: The Collapsed setting indicates the default state of any marker in which they are not visible.
The screenshot below demonstrates how the Sparkline looks as a result of the following settings:
Markers can be configured in the following aspects:
Selecting the data points to indicate, individually or in combination such as the first, last, highest, lowest and the negative values; for details, refer to the Property settings block.
Size
Color
For details on how to configure the markers’ size and color, refer to the Configuring Markers topic.
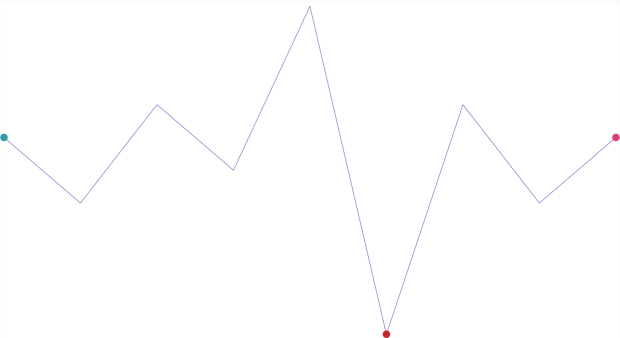
The code below demonstrates how to display markers on the following data points:
The first data point
The last data point
On all negative data points
In C#:
this.UltraSparkline1.MarkerVisibility = Infragistics.Portable.Components.UI.Visibility.Collapsed;
this.UltraSparkline1.LowMarkerVisibility = Infragistics.Portable.Components.UI.Visibility.Collapsed;
this.UltraSparkline1.HighMarkerVisibility = Infragistics.Portable.Components.UI.Visibility.Collapsed;
this.UltraSparkline1.FirstMarkerVisibility = Infragistics.Portable.Components.UI.Visibility.Visible;
this.UltraSparkline1.LastMarkerVisibility = Infragistics.Portable.Components.UI.Visibility.Visible;
this.UltraSparkline1.NegativeMarkerVisibility = Infragistics.Portable.Components.UI.Visibility.Visible;
In Visual Basic:
Me.UltraSparkline1.MarkerVisibility = Infragistics.Portable.Components.UI.Visibility.Collapsed
Me.UltraSparkline1.LowMarkerVisibility = Infragistics.Portable.Components.UI.Visibility.Collapsed
Me.UltraSparkline1.HighMarkerVisibility = Infragistics.Portable.Components.UI.Visibility.Collapsed
Me.UltraSparkline1.FirstMarkerVisibility = Infragistics.Portable.Components.UI.Visibility.Visible
Me.UltraSparkline1.LastMarkerVisibility = Infragistics.Portable.Components.UI.Visibility.Visible
Me.UltraSparkline1.NegativeMarkerVisibility = Infragistics.Portable.Components.UI.Visibility.VisibleThe following topics provide additional information related to this topic.