
This topic explains, with code examples, how to implement interpolation of unknown values in UltraSparkline™.
The following table lists the topics required as a prerequisite to understanding this topic.
This topic contains the following sections:
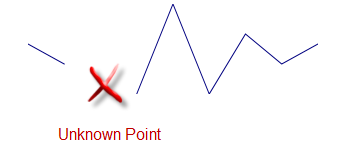
With the Interpolating Unknown Values feature, UltraSparkline can detect unknown values (Null or double.NaN`)` and render the space for the unknown values through a specified interpolation algorithm. If your data contains such values and you do not use this feature, meaning no Interpolation is specified, the unknown value will not be plotted.
If you have unknown values in your data set, the Interpolating Unknown Values feature provides you with the following options:
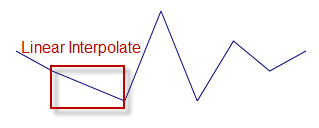
To interpolate the unknown values linearly connecting the data point before the null value point to the data point after the null value point.
Not to plot the unknown values – instead, a blank point will be inserted for any null value that exists in the data collection.
The Interpolating Unknown Values feature is both enabled and set (in terms of type of interpolation) by the UnknownValuePlotting property (See the Property settings block).
Only Null or double.NaN values are considered unknown. The expected value types are the numeric values such as integer or double. Non-numeric values are not considered unknown.
The following table maps the UltraSparkline interpolation option to the UnknownValuePlotting property settings that deliver them.
The screenshot below demonstrates a Sparkline rendered from the same data set but using different settings of the UnknownValuePlotting property:
The code below demonstrates handling unknown values using the linear interpolation option.
In C#:
this.UltraSparkline1.UnknownValuePlotting = UnknownValuePlotting.LinearInterpolate;In Visual Basic:
Me.UltraSparkline1.UnknownValuePlotting = UnknownValuePlotting.LinearInterpolateThe following topics provide additional information related to this topic.