
This topic provides detailed instruction on the controls and new and enhanced features for Infragistics® Windows Forms® 2016 Volume 1 release.
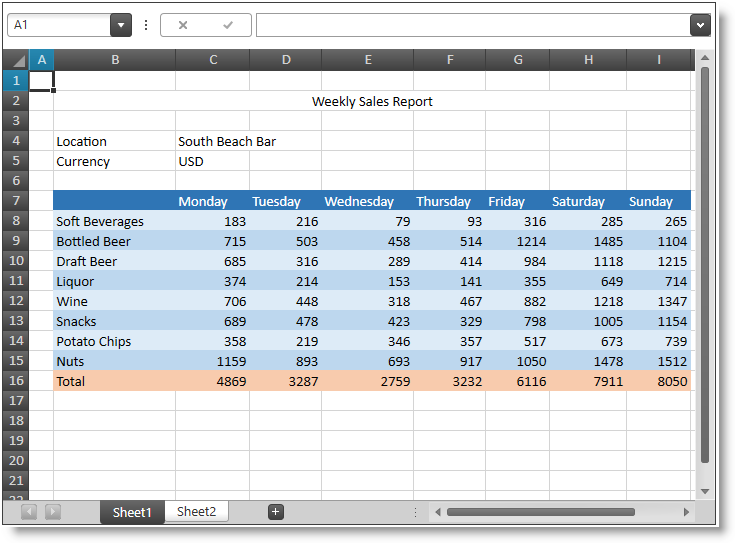
The UltraSpreadsheet™ control allows visualizing and editing of spreadsheet data, represented by the data model supported by the Infragistics Excel Engine. The following screenshot shows the UltraSpreadsheet™ control displaying some spreadsheet data:
Related topics:
The UltraGridGroups collection supports ExpansionIndicators, allowing the user to hide all columns assigned to them. This improves the readability of your grid by allowing users to quickly prioritize information most relevant to them.
The AutoEditMode property is used to specify whether typing a displayable character will automatically enter edit mode on the active cell and process that character as though the cell had already been in edit mode. This allows the user to select or activate a cell (which is not in edit mode) and begin typing immediately to edit the contents of the cells, instead of having to explicitly enter edit mode via a separate keyboard action (like pressing F2).
The UltraGrid supports BandExpansionIndicators at the header of each child band, allowing for collapse/expand funcitonality on each child band. This improves ease of navigation between sibling bands with large data sets and reduces information clutter on the UI.
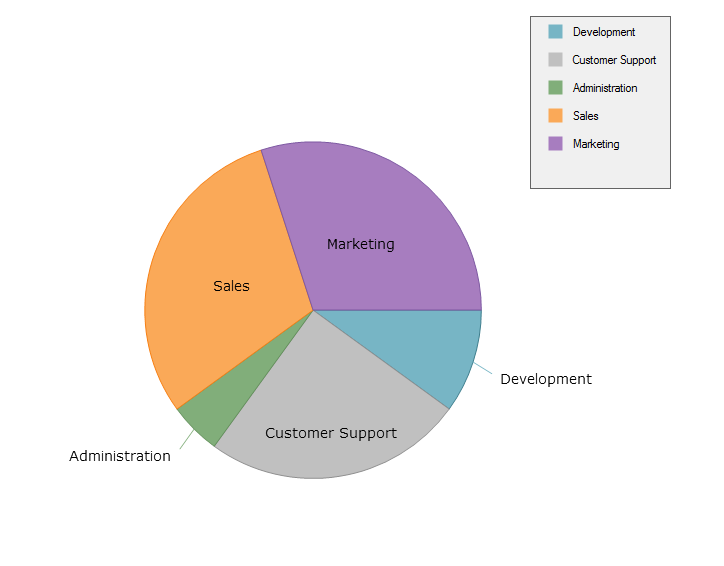
The UltraPieChart™ is a specialized control that renders a pie chart, consisting of a circular area divided into sections. Each section has arc length proportional to its underlying data value.
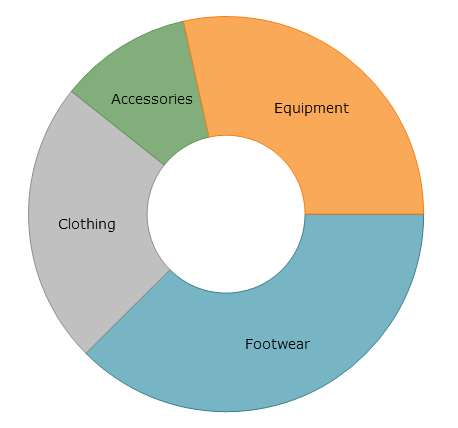
The UltraDoughnutChart™ control is similar to the UltraPieChart™ –proportionally illustrating the occurrences of a variable or multiple variables in concentric rings. The following screenshot shows the UltraDoughnutChart control displaying some data:
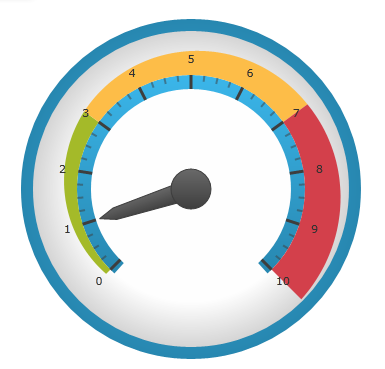
The UltraRadialGauge™ control is a data visualization tool capable of displaying a gauge containing a number of visual elements, such as a scale with tick marks and labels, a needle, and a number of ranges. Create a scale by supplying MinimumValue and MaximumValue values and point the needle to a value by setting the Value property. The gauge also supports ranges providing visual cues for the scale, for more information see the Configuring Ranges topic
Industries have created standards around barcode technology such as creating barcodes that provide capabilities unique to their industries. The vision for the Barcode™ control is to provide you with a control that is capable of rendering on screen barcode images that conform to the various widely adopted barcodes standards; this control abstracts much of the process and detail of barcode creation from you, allowing you to easily embed data in barcode format into your applications. The Barcode™ control provides support for the following barcode symbology:

The Right-to-Left mode in the UltraTabControl & UltraTabStripControl applies to the tabs and their corresponding position at the top of the control.
Related topics: