
Starting in the Ultimate UI for Windows Forms 2007 Volume 3 release, a new histogram chart has been added to the WinChart™ component.
A histogram chart is a graphical representation of a table that shows what proportion of results fall into each category. A histogram chart can also display a normal distribution curve for that data.
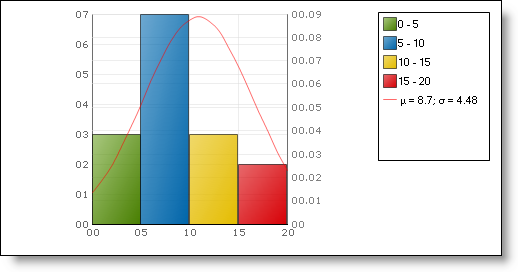
The following screen shot shows a histogram chart with the normal distribution curve displayed.