
In the 2006 Volume 1 release, we offered a number of new 3D charts, as well as redesigned existing 3D charts to take advantage of the new 3D chart-rendering engine.
In this release, we’ve completed the redesign of the existing 3D charts so that now all 3D charts utilize the power of the improved 3D rendering engine. Click each link below to view an example image of the remaining 3D charts, which are now much improved:
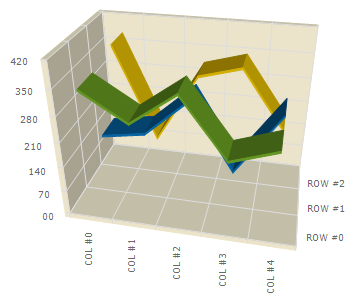
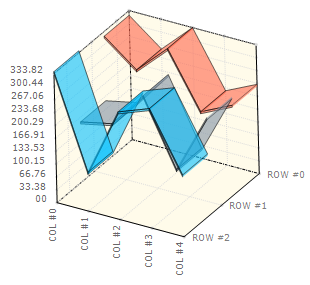
An example of the dramatic improvement in rendering quality is demonstrated in the screenshots of the 3D line chart below. On the left is an example of a line chart rendered using the original 3D engine, and on the right is an example of the same line chart rendered using the new 3D rendering engine. Notice the substantial improvement in rendering quality and appearance of the 3D line chart, including greatly improved shading and lighting effects now that it has been rendered with our new 3D chart-rendering engine!