
The WinGauge control graphically depicts one or more data values within a range of values using needles and markers. The control is commonly used in dashboard-style user interfaces found in enterprise and industrial applications. You can consider the Gauge control itself as a surface that can host one or more individual gauges. Gauges can be arranged in any fashion to achieve the most complex series of readouts.
Gauge supports the following features:
Gauges Collection – One or many Gauges can be added to Gauge, and arranged in any pattern.
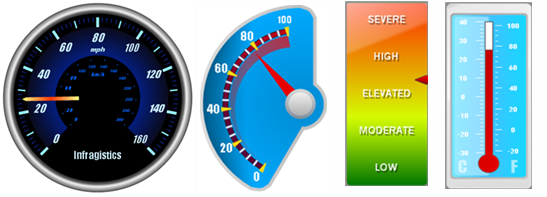
Gauge Types – Select from LinearGauge, RadialGauge and DigitalGauge types.
Brush Elements – The various rendered graphical elements can be highly customized by leveraging the BrushElement property.
Tickmarks – Show graphical "ticks" at varying frequencies to represent values within a given range.
Labels – Show individual values at varying frequencies within the given range.
Markers – Indicate the current value by utilizing a Needle or Bar marker.
Annotations – Annotate any point within Gauge with a Box or Ellipse.