
This topic provides an overview of the WinPivotGrid™ control and its main features.
The following table lists the concept required as a prerequisite to understanding this topic.
This topic contains the following sections:
The UltraWinPivotGrid control can serve as a tool for summarizing your data, and allows you to create complex business analysis applications. It uses OLAP to present the results of multidimensional data, making it easy to visualize the data in a sliced dimension.
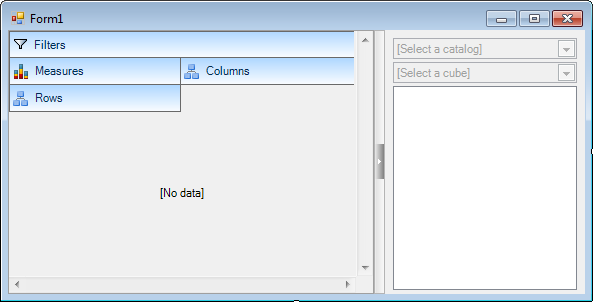
The four crucial elements of the WinPivotGrid control are the following areas known as drop areas:
Rows – Drop area for rows
Columns – Drop area for columns
Measures – Drop area for numeric values queried for given rows and columns
Filters – (optional) Drop area for filtered criteria that help to narrow down the data to display as part of the query
The data area is reserved to represent the Rows/Columns; RowColumn headers and cell values for measures.
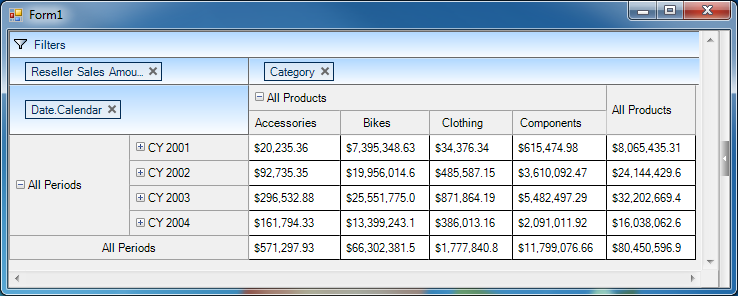
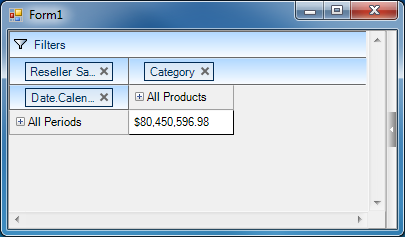
By default, when Rows/Columns are dropped in the drop areas dimensions collapse. The ‘+’ sign located in the Row/Column header allows to Expand/Collapse.
Assignment of the Rows/Columns is either performed automatically, dropping them on the form, or manually when adding the dimensions for Rows/Columns via code, for example:
Rows = "[Date].[Calendar]"
Columns = "[Product].[Category]"
Measures = "[Measures].[Reseller Sales Amount]"
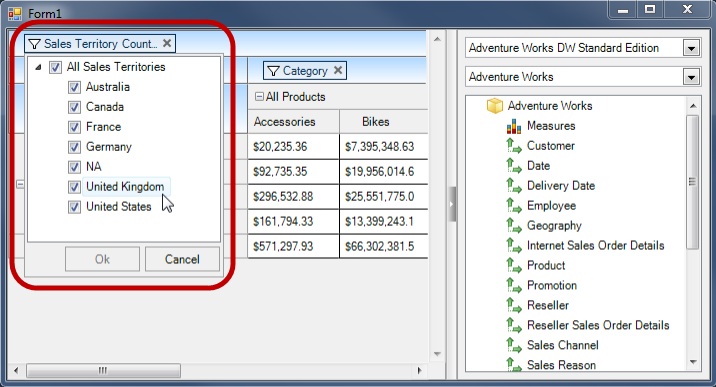
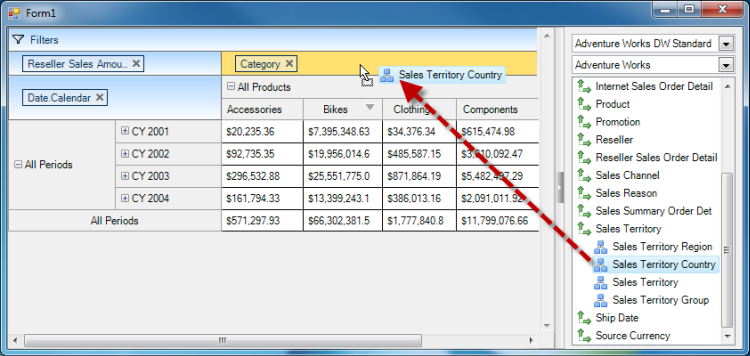
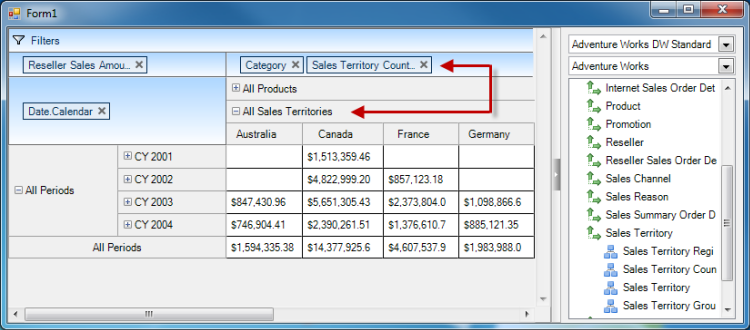
Filtering is an essential feature that allows narrowing down the summarized data into more specific fields for statistics as it is illustrated in the following screenshot:
Filters="[Sales Territory].[Sales Territory Country]"
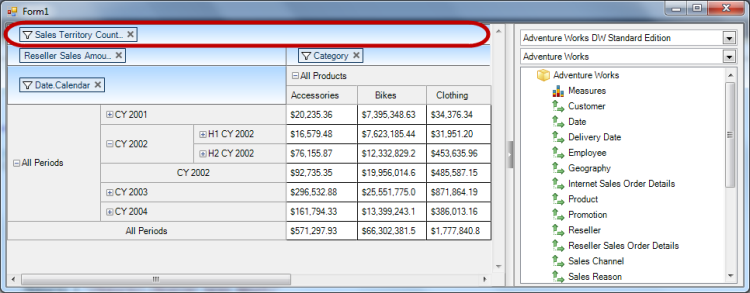
Filtering also provides runtime capability with a dropdown menu allowing the user to filter out columns by clicking the filter icon and using the checkboxes to select/unselect columns.
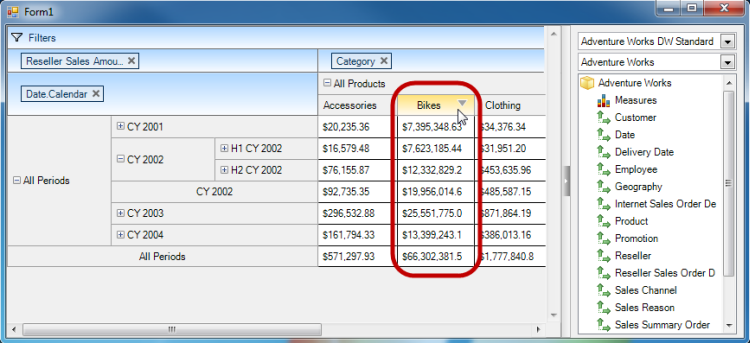
The column headers allow sorting, and as it is illustrated in the following screenshot with Bikes column, when you hover the mouse point over the column header the sort indicator appears:
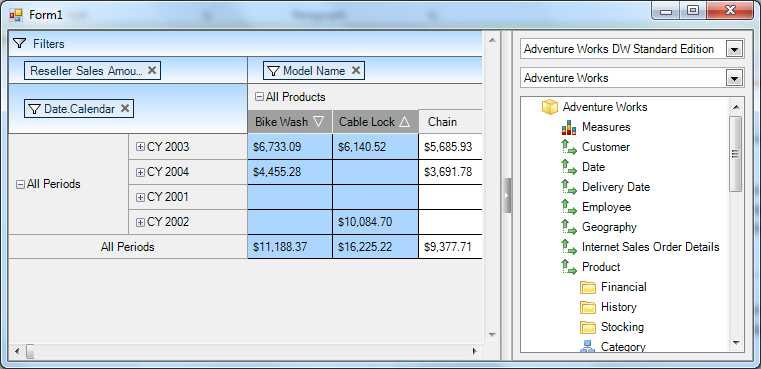
Multi-column sorting is another sort feature that you can perform by pressing down the shift key on the keyboard and clicking the sort indicator located on a column header.
The following screenshot illustrates multi-column sorting with “Model Name” column dimansion that contains multiple columns. The two highlighted columns below are sorted individually in Descending / Ascending order.
The WinPivotGrid allows data binding directly to a data source, and also using the MdxDataSelector. The Multidimensional Expression (MDX) data selector functions as a provider for the multidimensional data from OLAP data services.
The MdxDataSelector consists of two dropdowns for data catalogs and OLAP cubes, and a tree structure to display the measures and dimensions.
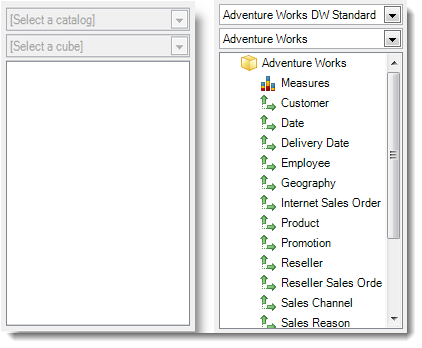
The following screenshot illustrates selecting and dropping a dimension from data selector onto the pivot column drop area.
The following topics provide additional information related to this topic.