
This topic demonstrates the procedure with code examples, how to display Point series in XamDataChart™.
The following table lists the materials required as a prerequisite to understanding this topic.
This topic contains the following sections:
The Point Series is one of the chart types in XamDataChart’s family of category series. It is designed to render the data as points or markers on the chart. The numeric values correspond to Y axis, and the X axis is used for displaying the labels.
The XamDataChart supports single or multiple point series objects to be rendered, meaning one collection or more than one collection of data.
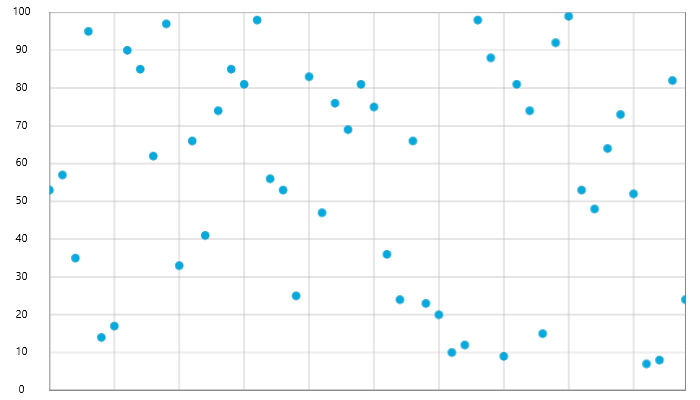
Figure 1: Sample implementation of a single PointSeries type.
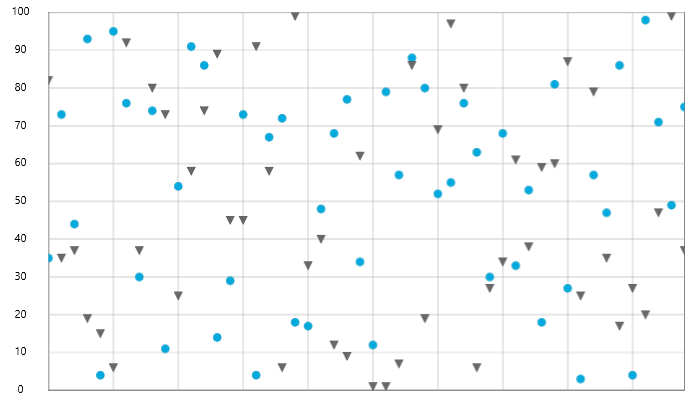
Figure 2: Sample implementation of multiple PointSeries types.
Although the XamDataChart supports plotting unlimited number of various types of series, it is recommended to use the PointSeries with similar types of series. Refer to the Multiple Series topic for information on what types of series are recommended with the Area Series and how to plot multiple types of series.
While the XamDataChart control allows you to easily bind it to your own data item, make sure to supply the appropriate amount and type of data that the series requires. If the data does not meet the minimum requirements based on the type of series that you are using, an error is generated by the control. Refer to the Series Requirements and Category Series topics for more information on data series requirements.
The following is a list of data requirements for the PointSeries type:
The data item must contain at least one numeric property.
The data item may contain an optional string or date time property for labels.
The data source should contain at least one data item in order to render points/markers of the series.
The PointSeries renders data using the following rules:
Each row in the data column specified as the ValueMemberPath property of the data mapping is plotted as a point/marker in the chart, with the number of points equal to the count of rows in the data source.
The string or date time column that is mapped to the Label property on the x-axis is used as the category labels. If the data mapping for Label is not specified, default labels are used.
Category labels are drawn on the x-axis. Data values are drawn on the y-axis.
When rendering, multiple instances of the PointSeries type is rendered in layers with each successive series rendered in front of the previous one in the Series collection of the XamDataChart control. For more information on this feature, refer to the Multiple Series topic.
The code snippet below shows how to bind the PointSeries object to sample of category data (which is available for download from Sample Energy Data resource). Refer to the data requirements section of this topic for information about data requirements of the PointSeries.
In XAML:
xmlns:local="clr-namespace:Infragistics.Models;assembly=YourAppName"
...
<ig:XamDataChart x:Name="DataChart" >
    <ig:XamDataChart.Resources>
        <local:EnergyDataSource x:Key="data" />
    </ig:XamDataChart.Resources>
    <ig:XamDataChart.Axes>
        <ig:NumericYAxis x:Name="YAxis"  />
        <ig:CategoryXAxis x:Name="XAxis" ItemsSource="{StaticResource data}"
                          Label="{}{Country}" />
    </ig:XamDataChart.Axes>
    <ig:XamDataChart.Series>
        <ig:PointSeries ItemsSource="{StaticResource data}" ValueMemberPath="Coal" Title="Coal"
                       XAxis="{Binding ElementName=XAxis}"
                       YAxis="{Binding ElementName=YAxis}">
        </ig:PointSeries>
        <ig:PointSeries ItemsSource="{StaticResource data}" ValueMemberPath="Hydro" Title="Hydro"
                       XAxis="{Binding ElementName=XAxis}"
                       YAxis="{Binding ElementName=YAxis}"
        </ig:PointSeries>
        <ig:PointSeries ItemsSource="{StaticResource data}" ValueMemberPath="Nuclear" Title="Nuclear"
                       XAxis="{Binding ElementName=XAxis}"
                       YAxis="{Binding ElementName=YAxis}">
        </ig:PointSeries>
        <ig:PointSeries ItemsSource="{StaticResource data}" ValueMemberPath="Gas" Title="Gas"
                       XAxis="{Binding ElementName=XAxis}"
                       YAxis="{Binding ElementName=YAxis}">
        </ig:PointSeries>
        <ig:PointSeries ItemsSource="{StaticResource data}" ValueMemberPath="Oil"  Title="Oil"
                       XAxis="{Binding ElementName=XAxis}"
                       YAxis="{Binding ElementName=YAxis}">
        </ig:PointSeries>
    </ig:XamDataChart.Series>
</ig:XamDataChart>
In C#:
var data = new EnergyDataSource();
var yAxis = new NumericYAxis();
var xAxis = new CategoryXAxis();
xAxis.ItemsSource = data;
xAxis.Label = "{Country}";

var series = new PointSeries();
series.ItemsSource = data;
series.ValueMemberPath = "Coal";
series.Title = "Coal";
series.XAxis = xAxis;
series.YAxis = yAxis;
var chart = new XamDataChart();
chart.Axes.Add(xAxis);
chart.Axes.Add(yAxis);
chart.Series.Add(series);
In Visual Basic:
Dim data As New EnergyDataSource()
Dim yAxis As New NumericYAxis()
Dim xAxis As New CategoryXAxis()
xAxis.ItemsSource = data;
xAxis.Label = "{Country}"

Dim series As New PointSeries()
series.ItemsSource = data
series.ValueMemberPath = "Coal"
series.Title = "Coal"
series.XAxis = xAxis
series.YAxis = yAxis
Dim chart As New XamDataChart()
chart.Axes.Add(xAxis)
chart.Axes.Add(yAxis)
chart.Series.Add(series)The following topics provide additional information related to this topic.