Version

Chart Title and Subtitle

Topic Overview

Purpose

This topic provides information on using the chart title and subtitle feature of the XamDataChart™ chart control.

Required background

The following topic is a prerequisite to understanding this topic:

Topic Purpose

The XamDataChart requires a data object model to be mapped to the control’s DataContext property. This article will provide a simple data object model but you can create your own and use it with this sample code instead.

Chart Title and Subtitle

Overview

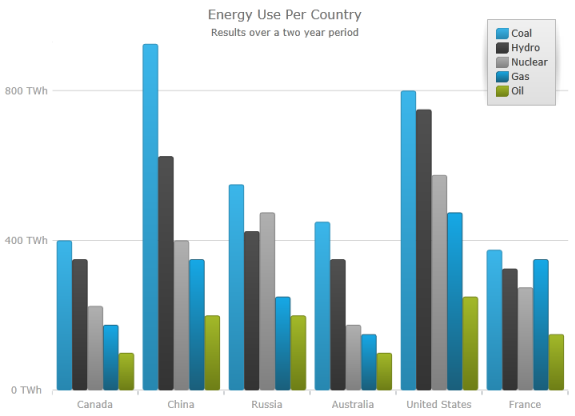
The title and subtitle feature of the XamDataChart control allows you to add information to the top section of the chart control.

When adding a title or subtitle to the chart control, the content of the chart automatically resizes allowing for the title and subtitle information.

Preview

The following screenshot is a preview of the chart control with a title and subtitle set.

xamDataChart Chart Title 01.png

Title and Subtitle

In order to add a title and subtitle to the chart control there is a set of properties added to the XamDataChart .

Property Name Property Type Description

String

Defines the title of the chart.

String

Defines the subtitle of the chart.

Styling the Title and Subtitle

There are properties provided that allows you to style the text color, the text font style and the text font size of the titles and subtitles.

Property Name Property Type Description

Brush

Title’s text color.

FontFamily

Title’s font name.

double

Title’s font size.

FontStyle

Title’s font style such as italic.

FontStretch

Title’s font stretch.

TitleFontWeight

Title’s font weight such as bold.

HorizontalAlignment

Title’s horizontal alignment.

Thickness

Title’s margin.

Brush

Subtitle’s text color.

FontFamily

Subtitle’s font name.

double

Subtitle’s font size.

FontStyle

Subtitle’s font style such as italic.

FontStretch

Subtitle’s font stretch.

SubtitleFontWeight

Subtitle’s font weight such as bold.

HorizontalAlignment

Subtitle’s horizontal alignment.

Thickness

Subtitle’s margin.

Example

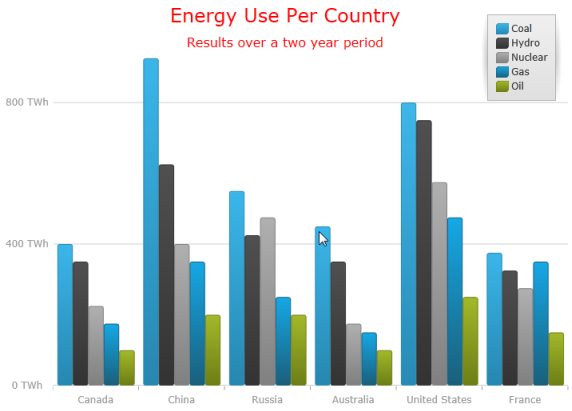
The following code example shows how to set title and subtitle properties on the chart control:

In XAML:

<ig:XamDataChart x:Name="DataChart"
                 Title="Energy Use Per Country"
                 TitleForeground="Red"
                 TitleFontFamily="Verdana"
                 TitleFontSize="24"
                 Subtitle="Results over a two year period"
                 SubtitleForeground="Red"
                 SubtitleFontFamily="Verdana"
                 SubtitleFontSize="16" >
</ig:XamDataChart>

The screenshot demonstrates how the chart control, with the title and subtitle, looks as a result of the above code snippet.

xamDataChart Chart Title 02.png

Related Content

The following topic provides additional information related to this topic:

Topic Purpose

Information on how to start using the XamDataChart control.