Thank you for your feedback! You have rated this topic in the last 30 days.
Chart Annotation Layers
Purpose
This topic provides conceptual information about the annotations and hover interactions available on the XamDataChart™ control including the different types of hover interaction layers available.
Required background
The following topics are prerequisites to understanding this topic:
The XamDataChart control requires a data object model to be mapped to control’s DataContext property. This article will provide a simple data object model but you can create your own and use it with this sample code instead.
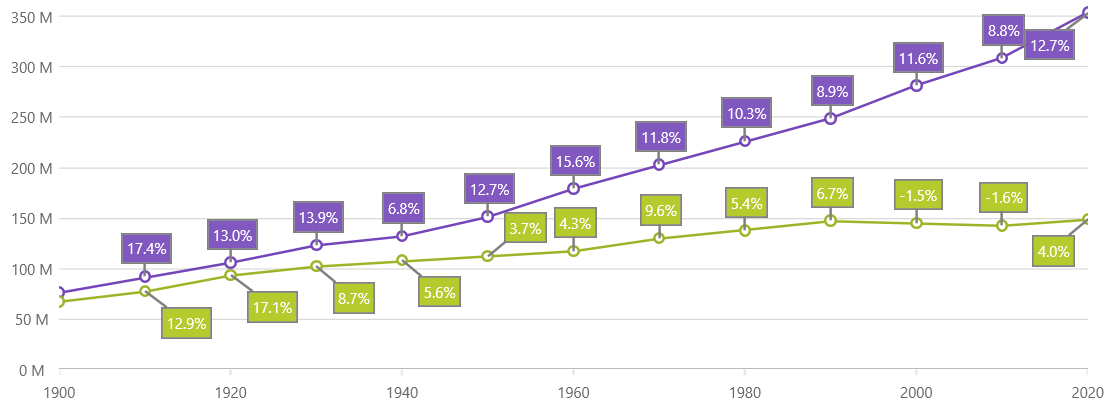
*This image is specifically showing only Data Annotations for technical analysis of Tesla Stock Data.
Common Properties
Common properties and methods overview
Since the hover interaction layers inherit from the Series object, they gain a lot of the properties and methods that are available on the Series base class. However, not everything from the Series class is meaningful for the hover interaction layers. For example, hover interaction layers are not designed to interact with the mouse and should not be hit testable; consequently they will not raise mouse related events.
For more information on the common properties and methods, see the Common Properties topic.
Types of Layers
Introduction
Currently there are 5 different hover interaction layers available on the XamDataChart control. Each of these hover interactions layers provides a different highlight, hover and tooltip interactions that may be used individually or combined with one another providing powerful hover interactions.
Types of Layers
The following table summarizes the different types of layers available on the XamDataChart control.
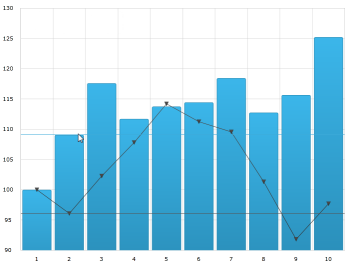
The CategoryHighlightLayer targets a category axis, or all category axes in the XamDataChart control. They draw a shape that illuminates the area of the axis closest to the cursor position.
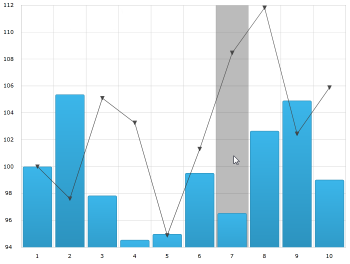
The CategoryItemHighlightLayer layer highlights items in a series that use a category axis either by drawing a banded shape at their position or by rendering a marker at their position.
Hover interactions are implemented through hover interaction layers which are series that are added to the series collection. These layers are dependent on the cursor position. Adding the cursor interaction layers to the XamDataChart control disables the default behavior of the crosshairs and/or tooltips (depending on which type of layer added).
The default behavior is disabled because it prevents visual confusion as the hover interaction layers perform a similar visual function compared to the built in behavior as the cursor moves. You can, however, override this behavior and allow the default crosshair functionality to perform in addition to the hover interaction layer functionality. Also of note, only target a series by one tooltip layer at a time. If you target more than one tooltip layer at a series, the hover interaction layers that use tooltips will not function as expected.
This is due to the fact that series tooltips are UIElements and can only be attached to the visual tree in one place at a time.
Using a tooltip for a series in more than one location at once is not allowed.
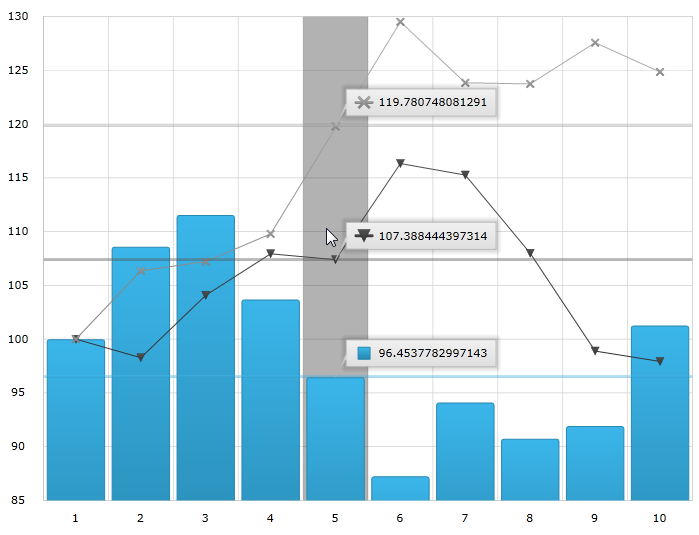
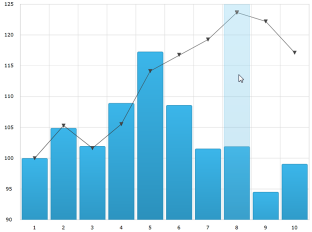
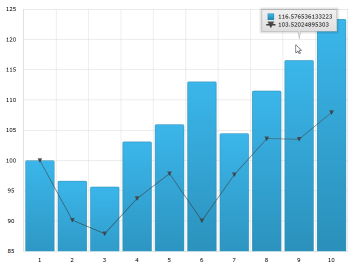
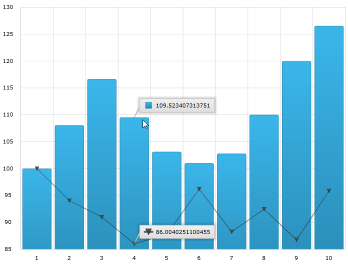
The following screenshot displays the XamDataChart control with the category highlight layer, the crosshair layer and the item tooltip layer implemented.
This topic provides information about the properties and methods that the hover interaction feature uses for highlighting, hovering and interacting with the tooltip interactions inherited from the Series class.
This topic provides information about the crosshair layer used for hover interactions. It describes the properties of the crosshair layer and provides an implementation example.
This topic provides information about the category highlight layer which is used for hover interactions. It describes the properties of the category highlight layer and provides an example of its implementation.
This topic provides information about the category item highlight layer used for hover interactions. It describes the properties of the category item highlight layer and provides an example of its implementation.
This topic provides information about the category tooltip layer used for hover interactions. It describes the properties of the category tooltip layer and provides an example of its implementation.
This topic provides information about the item tooltip layer which is used for hover interactions. It describes the properties of the item tooltip layer and also provides an example of its implementation.
This page has encountered an error. We've attempted to send the information to the server.