
This topic provides detailed instruction on how to create the XamDataChart™ control in the Microsoft® Blend.
The following topics are prerequisites to understanding this topic:
This topic contains the following sections:
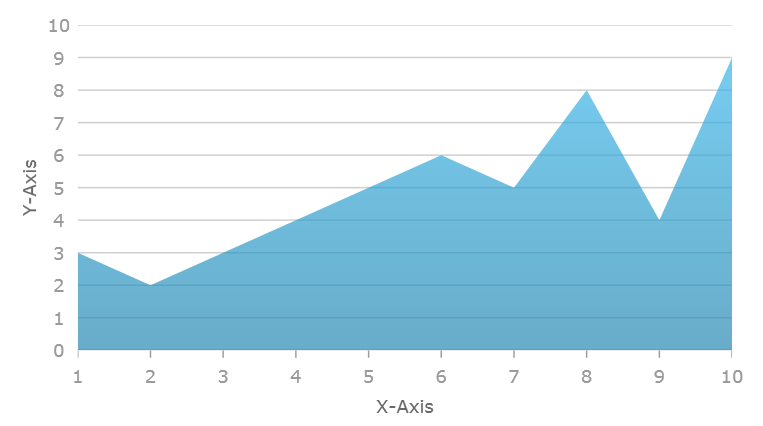
The following is the preview of the result of this topic
The following table lists requirements for creating the XamDataChart control.
The chart control supports various types of data visualizations called Series. These series objects can visualize wide range of data source. Refer to the Series Types topic for complete list of series supported in the chart control. Each type of series can plot data that meets certain requirements (such as number of data column and their types) as well as what type of axis can be used with it. Refer to the Series Requirements topic for requirements for each of the series.
For demonstration purpose, this topic uses Sample Energy Data with only one AreaSeries and two axes: CategoryXAxis and NumericYAxis.
Create WPF application project in the Microsoft® Blend.
Copy sample data code from the Sample Energy Data resource and add it to your project.
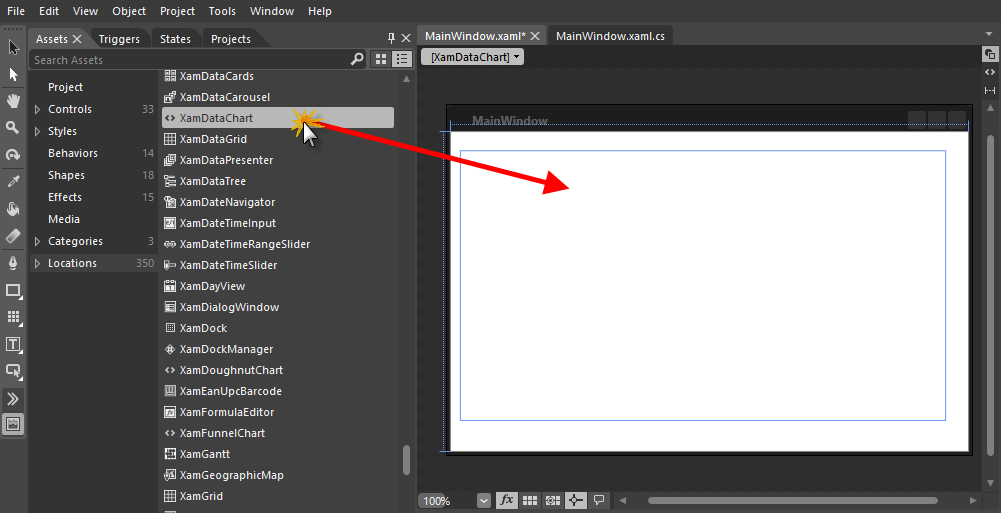
In the Assets toolbox panel, navigate to the XamDataChart control.
Drag and drop the XamDataChart control to design surface.
Select the XamDataChart control and go to Properties panel.
The following Infragistics Libraries will be added to your project:
InfragisticsWPF.Controls.Charts.XamDataChart.dll
InfragisticsWPF.DataVisualization.dll
InfragisticsWPF.v26.1.dll
In the Properties panel, navigate to the DataContext property
Click the New button.
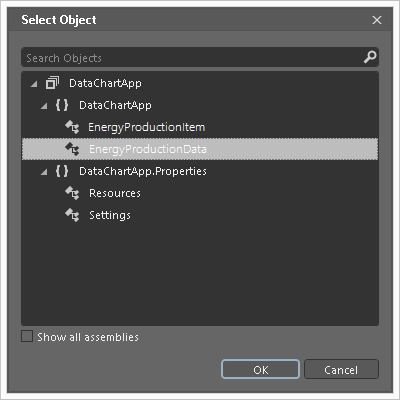
Select EnergyProductionData object and then click the OK button.
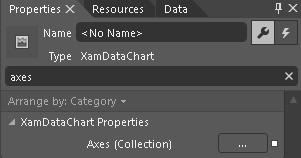
In the Properties panel, navigate to the Axes (Collection) property of the Data Chart control
Click ellipses (…) button next to Axes (Collection) property.
Select CategoryXAxis from drop-down control and click the Add button.
Select NumericYAxis from drop-down control and click the Add button.
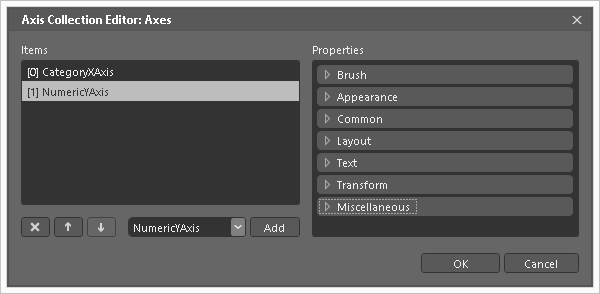
Click the OK button to close the Axes Collection Editor.
In design surface, change current selection to the CategoryXAxis object:
Right click on center of the Data Chart
Navigate to the Set Current Selection menu item
Select the CategoryXAxis menu item
In Properties panel, set the following properties of the CategoryXAxis object:
In design surface, change current selection to the NumericYAxis object:
Right click on center of the Data Chart
Navigate to the Set Current Selection menu item
Select the NumericYAxis menu item
In Properties panel, set the following properties of the NumericYAxis object:
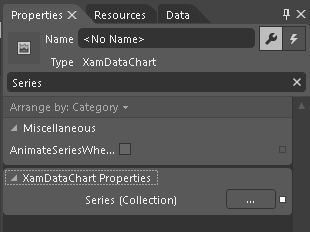
In the Properties panel, navigate to the Series (Collection) property of the Data Chart control.
Click ellipses (…) button next to Series (Collection) property.
Select AreaSeries from drop-down control and click the Add button.
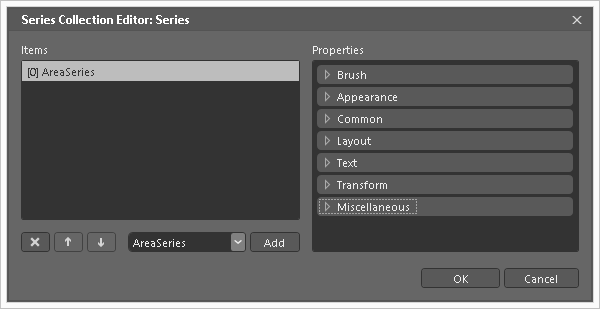
Click the OK button to close the Series Collection Editor
In design surface, change current selection to the AreaSeries object
Right click on center of the Data Chart
Navigate to the Set Current Selection menu item
Select the AreaSeries menu item
In Properties panel, set the following properties of the AreaSeries object
The following topics provide additional information related to this topic.