
This topic provides detailed instruction on how to create the XamDataChart™ control in XAML code
The following topics are prerequisites to understanding this topic:
This topic contains the following sections:
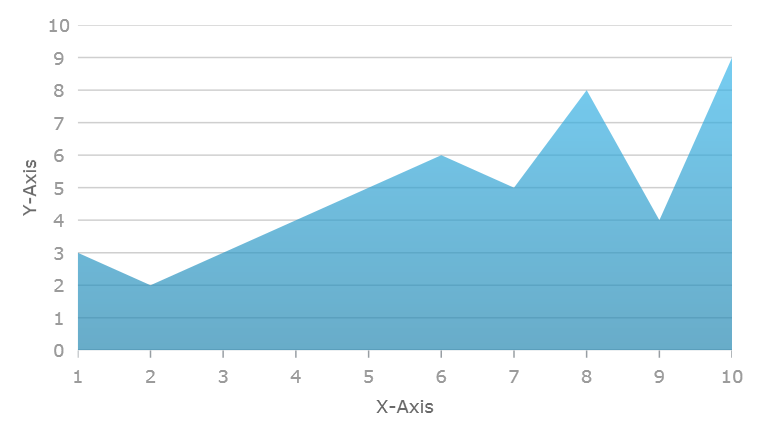
The following is the preview of the result of creating chart control in XAML code.
The following table lists requirements for creating the XamDataChart control.
The chart control supports various types of data visualizations called Series. These series objects can visualize wide range of data source. Refer to the Series Types topic for complete list of series supported in the chart control. Each type of series can plot data that meets certain requirements (such as number of data column and their types) as well as what type of axis can be used with it. Refer to the Series Requirements topic for requirements for each of the series.
For demonstration purpose, this topic uses Sample Energy Data with only one AreaSeries and two axes: CategoryXAxis and NumericYAxis.
Create WPF application project using Visual Studio 2013-2017 or latest and call it SampleApp
Add the following namespace declarations to the main XAML file:
In XAML:
xmlns:ig="http://schemas.infragistics.com/xaml"
xmlns:local="clr-namespace:SampleApp"
Add the following NuGet package to the SampleApp project:
Infragistics.WPF.Charts
For more information on setting up the NuGet feed and adding NuGet packages, you can take a look at the following documentation: NuGet Feeds.
Copy sample data code from the Sample Energy Data resource and add it to the SampleApp project
Create an instance of category sample data:
In XAML:
<Grid>
    <Grid.Resources>
        <local:EnergyDataSource x:Key="data"/>
    </Grid.Resources>
</Grid>
Create an instance an instance of the chart control with settings for one series and two axes.
In XAML:
<ig:XamDataChart x:Name="Chart" >
    <ig:XamDataChart.Axes>
        <!-- axes here -->
    </ig:XamDataChart.Axes>
    <ig:XamDataChart.Series>
        <!-- series here  -->
    </ig:XamDataChart.Series>
</ig:XamDataChart >
Create category x-axis for displaying labels and numeric y-axis for displaying values
In XAML:
<ig:XamDataChart.Axes>
    <ig:CategoryXAxis x:Name="xAxis" ItemsSource="{StaticResource data}" Label="{}{Country}" />
    <ig:NumericYAxis  x:Name="yAxis" />
</ig:XamDataChart.Axes>
Create an instance of a series and with bounding to the sample data source and set data mapping. In addition, the series must have settings for two axes created in previous section.
In XAML:
<ig:XamDataChart.Series>
    <ig:AreaSeries ItemsSource="{StaticResource data}"
                  ValueMemberPath="Coal"
                  XAxis="{Binding ElementName=xAxis}"
                  YAxis="{Binding ElementName=yAxis}">
    </ig:AreaSeries>
</ig:XamDataChart.Series>
The following topics provide additional information related to this topic.