
In Ultimate UI for WPF, the DataAnnotationLineLayer renders multiple lines between 2 points in plot area of the XamDataChart component. This data annotation layer can be used to annotate stock chart with growth and decline in stock prices. Similarly to all series, the DataAnnotationLineLayer also supports data binding via the ItemsSource property that can be set to a collection of data items which should have at least 4 numeric data columns representing x/y coordinates of starting point and ending point of the lines. The starting points should be mapped using using StartValueXMemberPath and StartValueYMemberPath properties and the ending points should be mapped using EndValueXMemberPath and EndValueYMemberPath properties.
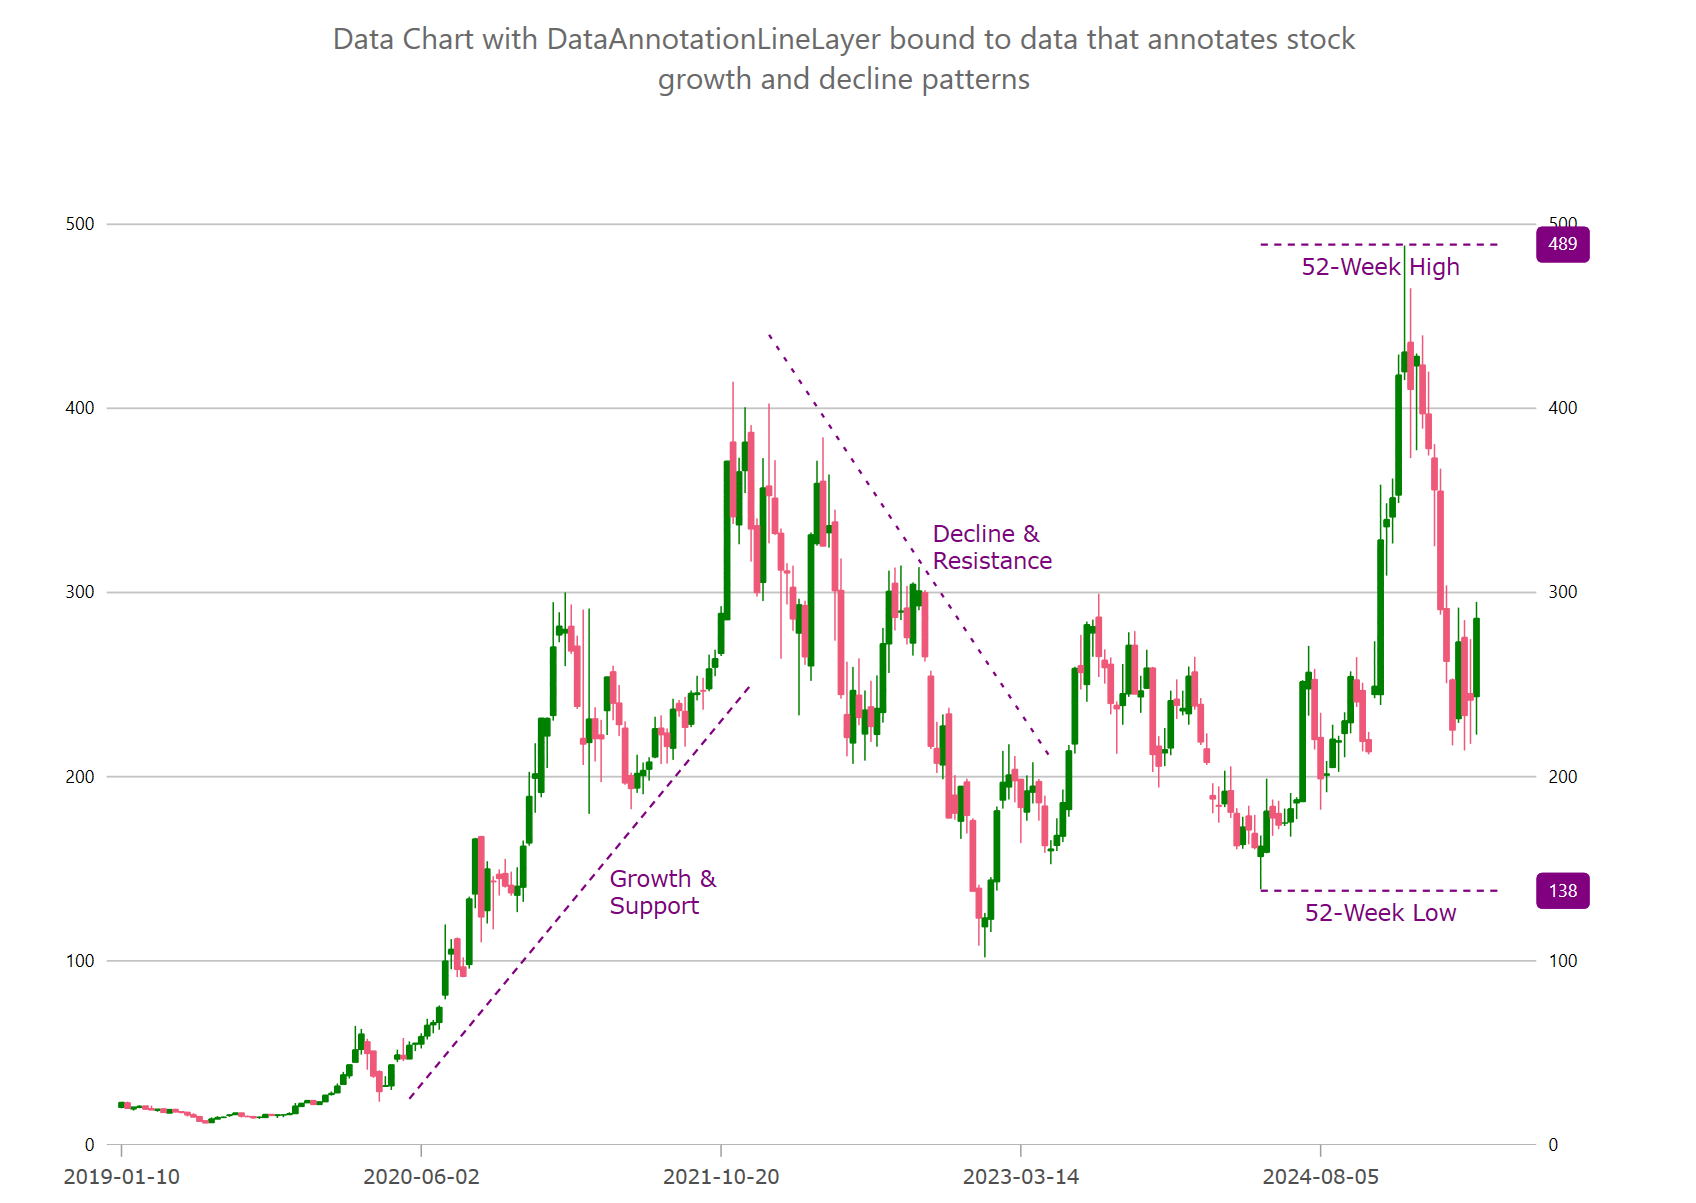
For example, you can use DataAnnotationLineLayer to annotate growth and decline patterns in stock prices and 52-week high and low of stock prices on y-axis.
The following code snippet demonstrates how to render a few line annotation layers as shown in the picture above. Also, this example shows how to render custom overlay text in plot that is explained more in detailed in the [Chart Overlay Text] topic.
In XAML:
<ig:DataAnnotationLineLayer
StartValueXMemberPath="StartX"
StartValueYMemberPath="StartY"
EndValueXMemberPath="EndX"
EndValueYMemberPath="EndY"
ItemsSource="{Binding}" />
In C#:
var xAxis = new CategoryXAxis
{
    Label = "Date",
    DataSource = data,
    LabelMargin = new Padding(0, 15, 0, 15),
};

var yAxis = new NumericYAxis
{
    MinimumValue = 0,
    MaximumValue = 550,
    LabelLocation = AxisLabelsLocation.OutsideLeft,
    LabelFontSize = 12,
    LabelExtent = 80,
    LabelMargin = new Padding(8, 3, 8, 5)
};
chart.Axes.Add(xAxis);
chart.Axes.Add(yAxis);

chart.Series.Add(CreateStock52WeekRange(yAxis));
chart.Series.Add(CreateStockGrowthAndDecline(xAxis));

public static Series CreateStock52WeekRange(Axis targetAxis)
{
    var annoLayer = new DataAnnotationLineLayer();
    annoLayer.StartValueXMemberPath = "StartX";
    annoLayer.StartValueYMemberPath = "StartY";
    annoLayer.EndValueXMemberPath = "EndX";
    annoLayer.EndValueYMemberPath = "EndY";
    annoLayer.TargetAxis = targetAxis;
    annoLayer.DataSource = new List<Annotation>
    {
        new Annotation() {
            StartX = 190, StartY = 138,
            EndX = 230, EndY = 138,
            Label = "52-Week Low" },
        new Annotation() {
            StartX = 190, StartY = 481,
            EndX = 230, EndY = 481,
            Label = "52-Week High" },
    };

    // setting optional annotation properties
    annoLayer.Brush = Brushes.Purple;
    annoLayer.Outline = Brushes.Purple;
    annoLayer.AreaFillOpacity = 0.1;
    annoLayer.StartLabelXDisplayMode = DataAnnotationDisplayMode.Hidden;
    annoLayer.StartLabelYDisplayMode = DataAnnotationDisplayMode.DataValue;
    annoLayer.EndLabelXDisplayMode = DataAnnotationDisplayMode.Hidden;
    annoLayer.EndLabelYDisplayMode = DataAnnotationDisplayMode.DataValue;
    annoLayer.CenterLabelXDisplayMode = DataAnnotationDisplayMode.Hidden;

    // adding optional overlay text
    annoLayer.OverlayTextColor = Brushes.Purple;
    annoLayer.OverlayTextMemberPath = "Label";

    return annoLayer;
}

public static Series CreateStockGrowthAndDecline(Axis targetAxis)
{
    var annoLayer = new DataAnnotationLineLayer();
    annoLayer.StartValueXMemberPath = "StartX";
    annoLayer.StartValueYMemberPath = "StartY";
    annoLayer.EndValueXMemberPath = "EndX";
    annoLayer.EndValueYMemberPath = "EndY";
    annoLayer.TargetAxis = targetAxis;
    annoLayer.DataSource = new List<Annotation>
    {
        new Annotation() {
            StartX = 48, StartY = 25,
            EndX = 105, EndY = 250,
            Label = "Growth &\nSupport"
        },
        new Annotation() {
            StartX = 108, StartY = 440,
            EndX = 155, EndY = 210,
            Label = "Decline &\nResistance"
        },
    };

    // setting optional annotation properties
    annoLayer.StartLabelXDisplayMode = DataAnnotationDisplayMode.Hidden;
    annoLayer.EndLabelXDisplayMode = DataAnnotationDisplayMode.Hidden;
    annoLayer.CenterLabelXDisplayMode = DataAnnotationDisplayMode.Hidden;
    annoLayer.AnnotationBackgroundMode = AnnotationAppearanceMode.BrightnessShift;
    annoLayer.Brush = Brushes.Purple;

    // adding optional overlay text
    annoLayer.OverlayTextColor = Brushes.Purple;
    annoLayer.OverlayTextMemberPath = "Label";
    annoLayer.OverlayTextHorizontalMargin = 60;
    annoLayer.OverlayTextVerticalMargin = -10;

    return annoLayer;
}The following code example shows how you can customize the DataAnnotationLineLayer by setting styling properties such as background, border color, and border thickness of axis annotations as styling properties of the Overlay Text.
In C#:
chart.Series.Add(StylingDataAnnotationLineLayer(xAxisBottom));

public Series StylingDataAnnotationLineLayer(Axis targetAxis)
{
    var annoLayer = new DataAnnotationLineLayer();
    // NOTE see setup properties in the first examples

    // styling the starting point of annotation
    annoLayer.StartLabelDisplayMode = DataAnnotationDisplayMode.AxisValue;
    annoLayer.StartLabelTextColor = Brushes.White;
    annoLayer.StartLabelBackground = Brushes.Orange;
    annoLayer.StartLabelBorderColor = Brushes.Black;
    annoLayer.StartLabelBorderThickness = 1;
    annoLayer.StartLabelBorderRadius = 4;
    annoLayer.StartLabelPadding = new Thickness(4);

    // styling the ending point of annotation
    annoLayer.EndLabelDisplayMode = DataAnnotationDisplayMode.AxisValue;
    annoLayer.EndLabelTextColor = Brushes.White;
    annoLayer.EndLabelBackground = Brushes.Red;
    annoLayer.EndLabelBorderColor = Brushes.Black;
    annoLayer.EndLabelBorderThickness = 1;
    annoLayer.EndLabelBorderRadius = 4;
    annoLayer.EndLabelPadding = new Thickness(4);

    // styling optional label at center of annotations
    annoLayer.CenterLabelDisplayMode = DataAnnotationDisplayMode.AxisValue;
    annoLayer.CenterTextColor = Brushes.White;
    annoLayer.CenterBackground = Brushes.Green;
    annoLayer.CenterBorderColor = Brushes.Black;
    annoLayer.CenterBorderThickness = 1;
    annoLayer.CenterBorderRadius = 4;
    annoLayer.CenterPadding = new Thickness(4);

    // styling optional overlay text
    annoLayer.OverlayTextColor = Brushes.White;
    annoLayer.OverlayTextBackground = Brushes.Green;
    annoLayer.OverlayTextBorderColor = Brushes.Black;
    annoLayer.OverlayTextBorderThickness = 1;
    annoLayer.OverlayTextBorderRadius = 4;
    annoLayer.OverlayTextHorizontalMargin = 5;
    annoLayer.OverlayTextHorizontalPadding = 2;
    annoLayer.OverlayTextVerticalMargin = 5;
    annoLayer.OverlayTextVerticalPadding = 2;
    return annoLayer;
}The following table provides most important properties for the DataAnnotationLineLayer and their descriptions.