
In Ultimate UI for WPF, the DataAnnotationSliceLayer renders multiple vertical or horizontal lines that slice the chart at multiple values of an axis in the XamDataChart component. This data annotation layer is often used to annotate important events (e.g. company quarter reports) on x-axis or important values on y-axis. Setting the TargetAxis property to y-axis will render data annotation layer as horizontal slices or setting TargetAxis property to x-axis will render data annotation layer as vertical slices. Similarly to all series, the DataAnnotationSliceLayer also supports data binding via the ItemsSource property that can be set to a collection of data items which should have at least 1 numeric data column mapped to the AnnotationValueMemberPath property.
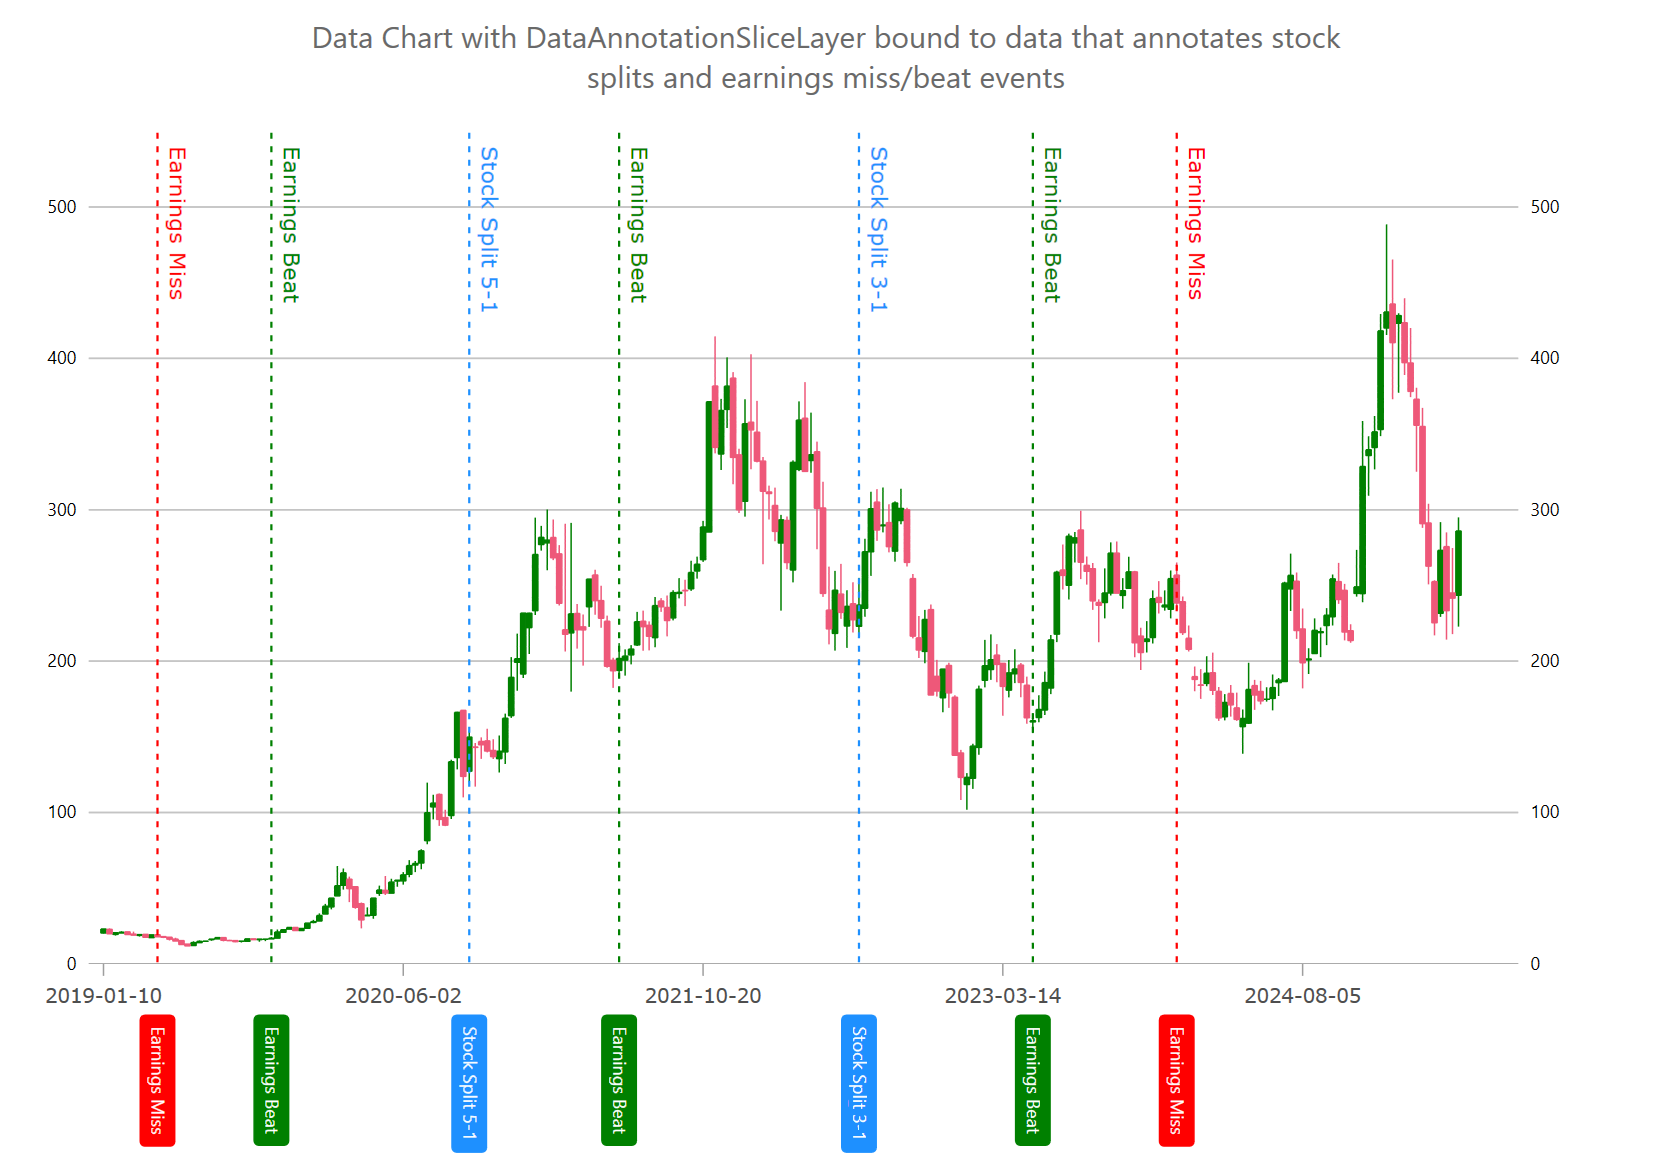
For example, you can use DataAnnotationSliceLayer to annotate stock prices with important events such as stock split and outcome of earning reports.
The following code snippet demonstrates how to render three slice annotation layers as shown in the picture above. Also, this example shows how to render custom overlay text in plot that is explained more in detailed in the Chart Overlay Text topic.
In XAML:
<ig:DataAnnotationSliceLayer
AnnotationValueMemberPath="Value"
AnnotationLabelMemberPath="Label"
TargetAxis="{Binding ElementName=xAxisBottom}"
ItemsSource="{Binding}"
/>
In C#:
var xAxisBottom = new CategoryXAxis
{
    Label = "Index",
    DataSource = DataPointsBoundToYourSeries,
    TickLength = 0,
    LabelLocation = AxisLabelsLocation.OutsideBottom,
    LabelFontSize = 12,
    LabelMargin = new Padding(0, 15, 0, 5),
    LabelExtent = 140,
    LabelAngle = 90,
    LabelTextColor = Color.Transparent,
};
chart.Axes.Add(xAxisBottom);

chart.Series.Add(CreateStockSplitAnnotations(xAxisBottom));
chart.Series.Add(CreateStockEarningsMissAnnotations(xAxisBottom));
chart.Series.Add(CreateStockEarningsBeatAnnotations(xAxisBottom));

public Series CreateStockSplitAnnotations(Axis targetAxis)
{
    var annoLayer = new DataAnnotationSliceLayer();
    annoLayer.Brush = Brushes.DodgerBlue;
    annoLayer.OverlayTextHorizontalMargin = 0;
    annoLayer.AnnotationLabelMemberPath = "Label";
    annoLayer.AnnotationValueMemberPath = "Value";
    annoLayer.AnnotationTextColor = Brushes.White;
    annoLayer.TargetAxis = targetAxis;
    annoLayer.DataSource = new List<Annotation>
    {
        new Annotation() { Value = 126, Label = "Stock Split 3-1" },
        new Annotation() { Value = 61, Label = "Stock Split 5-1" },
    };

    // adding optional overlay text
    annoLayer.OverlayTextMemberPath = "Label";
    annoLayer.OverlayTextLocation = OverlayTextLocation.OutsideTopRight;
    annoLayer.OverlayTextLocation = OverlayTextLocation.Hidden;
    annoLayer.OverlayTextAngle = 90;

    return annoLayer;
}

public Series CreateStockEarningsMissAnnotations(Axis targetAxis)
{
    var annoLayer = new DataAnnotationSliceLayer();
    annoLayer.Brush = Brushes.Red;
    annoLayer.AnnotationLabelMemberPath = "Label";
    annoLayer.AnnotationValueMemberPath = "Value";
    annoLayer.AnnotationTextColor = Brushes.White;
    annoLayer.TargetAxis = targetAxis;
    annoLayer.DataSource = new List<Annotation>
    {
        new Annotation() { Value = 9, Label = "Earnings Miss" },
        new Annotation() { Value = 179, Label = "Earnings Miss" },
    };

    // adding optional overlay text
    annoLayer.OverlayTextMemberPath = "Label";
    annoLayer.OverlayTextLocation = OverlayTextLocation.OutsideTopRight;
    annoLayer.OverlayTextAngle = 90;
    annoLayer.OverlayTextHorizontalMargin = 0;

    return annoLayer;
}

public Series CreateStockEarningsBeatAnnotations(Axis targetAxis)
{
    var annoLayer = new DataAnnotationSliceLayer();
    annoLayer.Brush = Brushes.Green;
    annoLayer.AnnotationLabelMemberPath = "Label";
    annoLayer.AnnotationValueMemberPath = "Value";
    annoLayer.AnnotationTextColor = Brushes.White;
    annoLayer.TargetAxis = targetAxis;
    annoLayer.DataSource = new List<Annotation>
    {
        new Annotation() { Value = 155, Label = "Earnings Beat" },
        new Annotation() { Value = 86, Label = "Earnings Beat" },
        new Annotation() { Value = 28, Label = "Earnings Beat" },
    };

    // adding optional overlay text
    annoLayer.OverlayTextMemberPath = "Label";
    annoLayer.OverlayTextLocation = OverlayTextLocation.OutsideTopRight;
    annoLayer.OverlayTextAngle = 90;
    annoLayer.OverlayTextHorizontalMargin = 0;
    return annoLayer;
}The following code example shows how you can customize the DataAnnotationSliceLayer by setting styling properties such as background, border color, and border thickness of axis annotations as styling properties of the Overlay Text.
In C#:
chart.Series.Add(StylingDataAnnotationSliceLayer(xAxisBottom));

public Series StylingDataAnnotationSliceLayer(Axis targetAxis)
{
    var annoLayer = new DataAnnotationSliceLayer();
    // NOTE see setup properties in the first examples

    // styling axis annotations
    annoLayer.AnnotationLabelDisplayMode = DataAnnotationDisplayMode.AxisValue;
    annoLayer.AnnotationTextColor = Brushes.White;
    annoLayer.AnnotationBackground = Brushes.Orange;
    annoLayer.AnnotationBorderColor = Brushes.Black;
    annoLayer.AnnotationBorderThickness = 1;
    annoLayer.AnnotationBorderRadius = 4;
    annoLayer.AnnotationPadding = new Thickness(4);

    // styling optional overlay text
    annoLayer.OverlayTextColor = Brushes.White;
    annoLayer.OverlayTextBackground = Brushes.Green;
    annoLayer.OverlayTextBorderColor = Brushes.Black;
    annoLayer.OverlayTextBorderThickness = 1;
    annoLayer.OverlayTextBorderRadius = 4;
    annoLayer.OverlayTextHorizontalMargin = 5;
    annoLayer.OverlayTextHorizontalPadding = 2;
    annoLayer.OverlayTextVerticalMargin = 5;
    annoLayer.OverlayTextVerticalPadding = 2;

    return annoLayer;
}The following table provides most important properties for the DataAnnotationSliceLayer and their descriptions.