
In Ultimate UI for WPF, the DataAnnotationStripLayer renders multiple vertical or horizontal strips between 2 values on an axis in the XamDataChart component. This data annotation layer can be used to annotate duration of events (e.g. stock market crash) on x-axis or important range of values on y-axis. Setting the TargetAxis property to y-axis will render data annotation layer as horizontal strips or setting TargetAxis property to x-axis will render data annotation layer as vertical strips. Similarly to all series, the DataAnnotationStripLayer also supports data binding via the ItemsSource property that can be set to a collection of data items which should have at least 1 numeric data column mapped to the AnnotationValueMemberPath property.
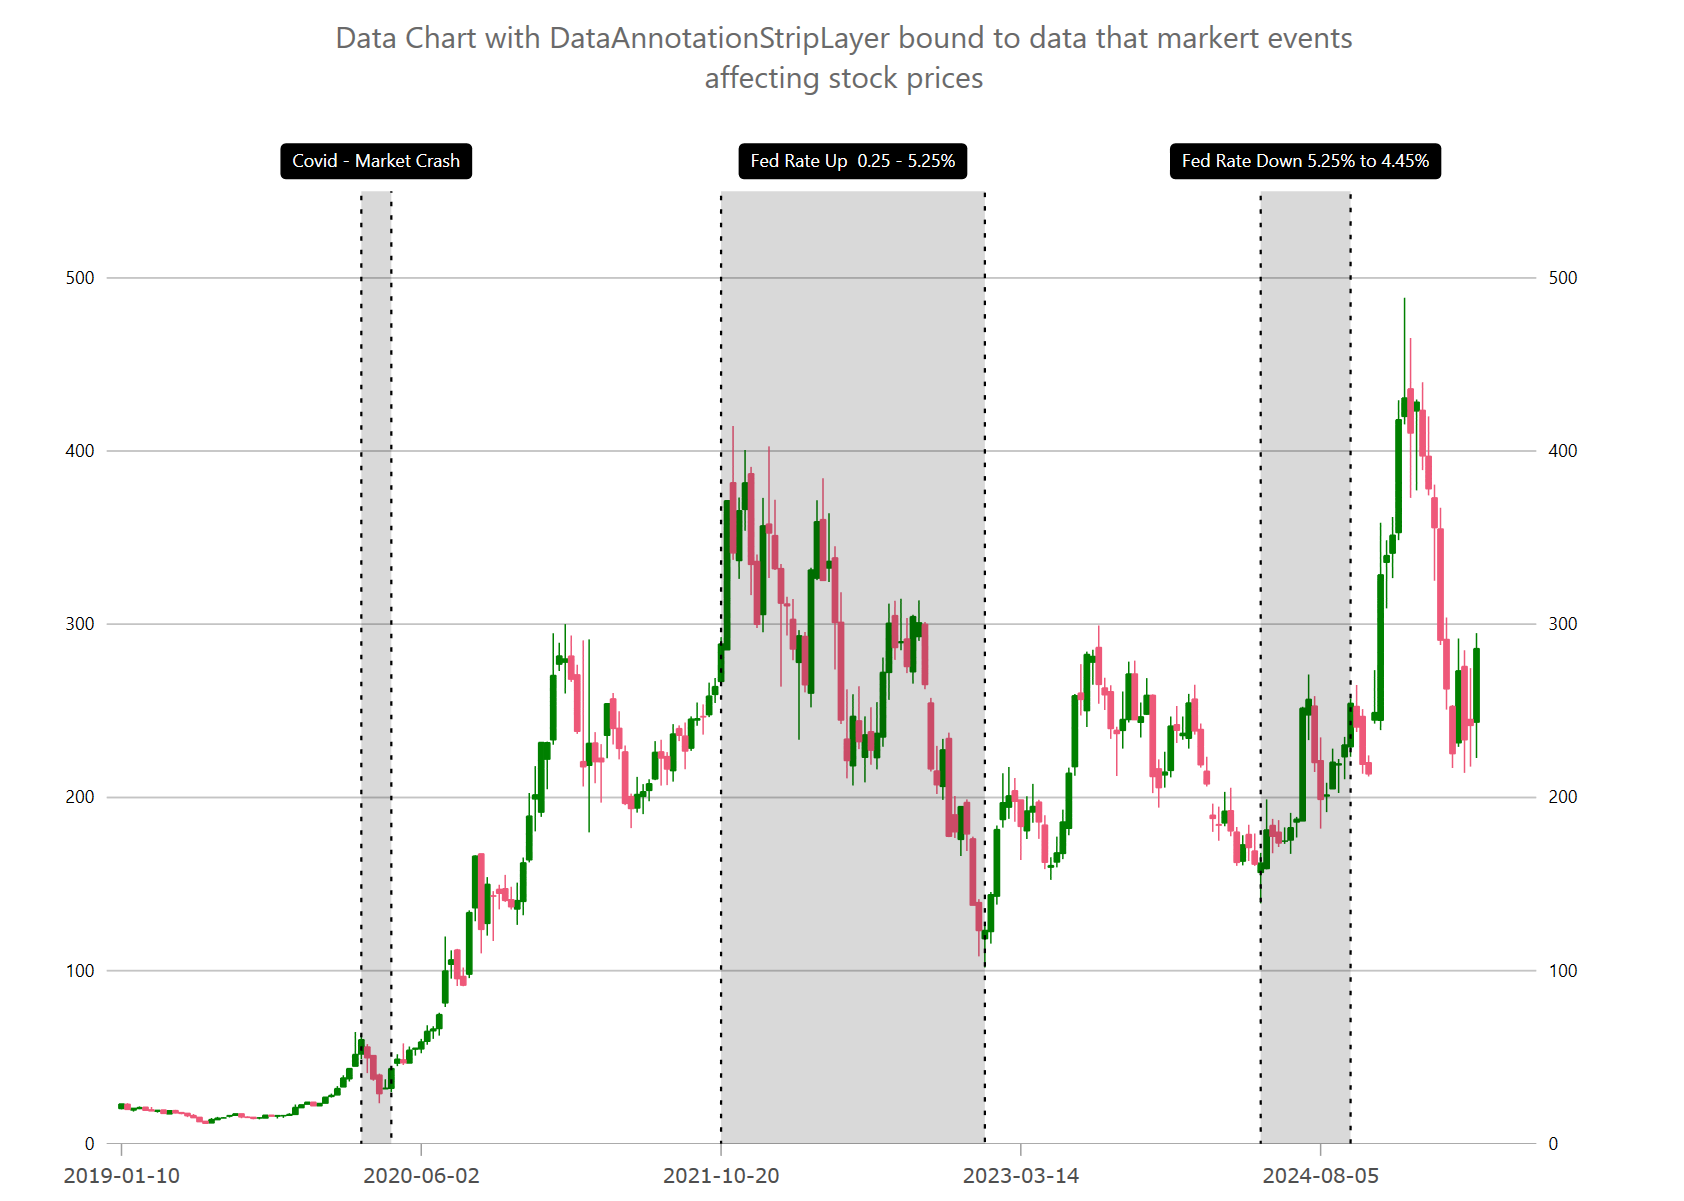
For example, you can use DataAnnotationStripLayer to annotate chart with stock market crashes and changes in federal interest rates.
The following code snippet demonstrates how to render DataAnnotationStripLayer as shown in the picture above. Also, this example shows how to render custom overlay text in plot that is explained more in detailed in the [Chart Overlay Text] topic.
In XAML:
<ig:DataAnnotationStripLayer
StartValueMemberPath="Start"
EndValueMemberPath="End"
ItemsSource="{Binding}" />
In C#:
var xAxisBottom = new CategoryXAxis
{
    Label = "Date",
    DataSource = data,
    TickLength = 0,
    LabelLocation = AxisLabelsLocation.OutsideTop,
    LabelFontSize= 12,
    LabelMargin = new Padding(8, 3, 8, 5),
    LabelExtent = 40,
    LabelTextColor = Color.Transparent,
};
chart.Axes.Add(xAxisBottom);

chart.Series.Add(CreateStockMarketEvents(xAxisBottom));

public Series CreateStockMarketEvents(Axis targetAxis)
{
    var annoLayer = new DataAnnotationStripLayer();
    annoLayer.Brush = Brushes.Black;
    annoLayer.Outline = Brushes.Black;
    annoLayer.StartValueMemberPath = "Start";
    annoLayer.EndValueMemberPath = "End";
    annoLayer.TargetAxis = targetAxis;
    annoLayer.DataSource = new List<Annotation>
    {
        new Annotation() { Start = 40, End = 45, Label = "Covid - Market Crash" },
        new Annotation() { Start = 100, End = 144, Label = "Fed Rate Up  0.25 - 5.25%"  },
        new Annotation() { Start = 190, End = 205, Label = "Fed Rate Down 5.25% to 4.45%"  },
    };

    // setting optional properties
    annoLayer.StartLabelDisplayMode = DataAnnotationDisplayMode.Hidden;
    annoLayer.EndLabelDisplayMode = DataAnnotationDisplayMode.Hidden;
    annoLayer.EndLabelDisplayMode = DataAnnotationDisplayMode.Hidden;
    annoLayer.CenterLabelDisplayMode = DataAnnotationDisplayMode.DataLabel;
    annoLayer.CenterLabelMemberPath = "Label";

    return annoLayer;
}The following code example shows how you can customize the DataAnnotationStripLayer by setting styling properties such as background, border color, and border thickness of axis annotations as styling properties of the Overlay Text.
In C#:
chart.Series.Add(StylingDataAnnotationStripLayer(xAxisBottom));

public Series StylingDataAnnotationStripLayer(Axis targetAxis)
{
    var annoLayer = new DataAnnotationStripLayer();
    // NOTE see setup properties in the first examples

    // styling start label of annotations
    annoLayer.StartLabelDisplayMode = DataAnnotationDisplayMode.AxisValue;
    annoLayer.StartLabelTextColor = Brushes.White;
    annoLayer.StartLabelBackground = Brushes.Orange;
    annoLayer.StartLabelBorderColor = Brushes.Black;
    annoLayer.StartLabelBorderThickness = 1;
    annoLayer.StartLabelBorderRadius = 4;
    annoLayer.StartLabelPadding = new Thickness(4);

    // styling end label of annotations
    annoLayer.EndLabelDisplayMode = DataAnnotationDisplayMode.AxisValue;
    annoLayer.EndLabelTextColor = Brushes.White;
    annoLayer.EndLabelBackground = Brushes.Orange;
    annoLayer.EndLabelBorderColor = Brushes.Black;
    annoLayer.EndLabelBorderThickness = 1;
    annoLayer.EndLabelBorderRadius = 4;
    annoLayer.EndLabelPadding = new Thickness(4);

    // styling center label of annotations
    annoLayer.AnnotationLabelDisplayMode = DataAnnotationDisplayMode.AxisValue;
    annoLayer.AnnotationTextColor = Brushes.White;
    annoLayer.AnnotationBackground = Brushes.Orange;
    annoLayer.AnnotationBorderColor = Brushes.Black;
    annoLayer.AnnotationBorderThickness = 1;
    annoLayer.AnnotationBorderRadius = 4;
    annoLayer.AnnotationPadding = new Thickness(4);

    // styling optional overlay text
    annoLayer.OverlayTextColor = Brushes.White;
    annoLayer.OverlayTextBackground = Brushes.Green;
    annoLayer.OverlayTextBorderColor = Brushes.Black;
    annoLayer.OverlayTextBorderThickness = 1;
    annoLayer.OverlayTextBorderRadius = 4;
    annoLayer.OverlayTextHorizontalMargin = 5;
    annoLayer.OverlayTextHorizontalPadding = 2;
    annoLayer.OverlayTextVerticalMargin = 5;
    annoLayer.OverlayTextVerticalPadding = 2;

    return annoLayer;
}The following table provides most important properties for the DataAnnotationStripLayer and their descriptions.