|
The Stacked 100-Area Series is identical to the StackedAreaSeries in all aspects except in their treatment of the values on y-axis. Instead of presenting a direct representation of the data, the Stacked100AreaSeries presents the data in terms of percent of the sum of all values in a data point.
|
|
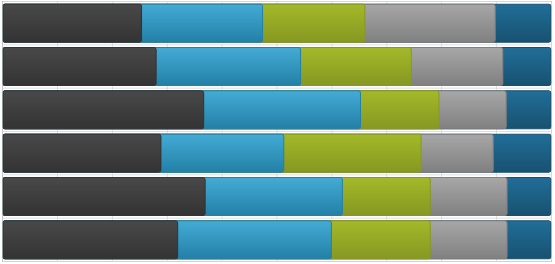
Same as the Stacked Bar Series type with the added feature of presenting data in terms of percent of all values in category instead of presenting a direct representation of the data.
|
|
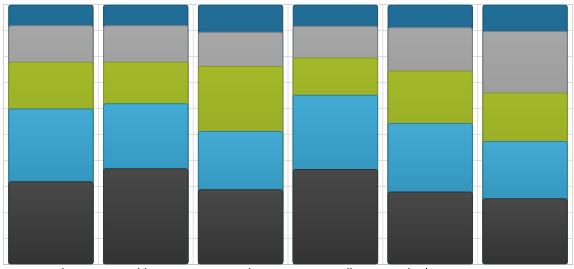
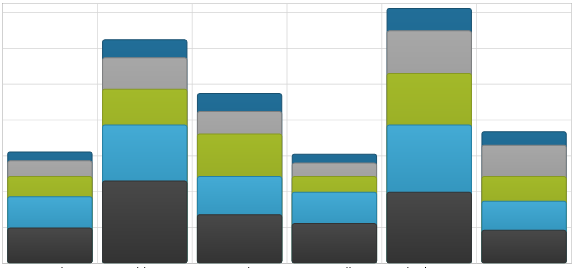
Same as the Stacked Column Series type with the added feature of presenting data in terms of percent of all values in the same category instead of presenting a direct representation of the data.
|
|
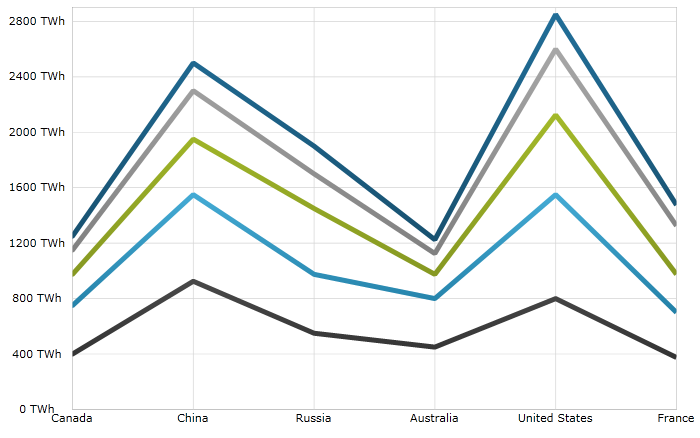
The Stacked 100-Line Series is identical to the StackedLineSeries in all aspects except in their treatment of the values on y-axis. Instead of presenting a direct representation of the data, the Stacked100LineSeries presents the data in terms of percent of the sum of all values in a data point.
|
|
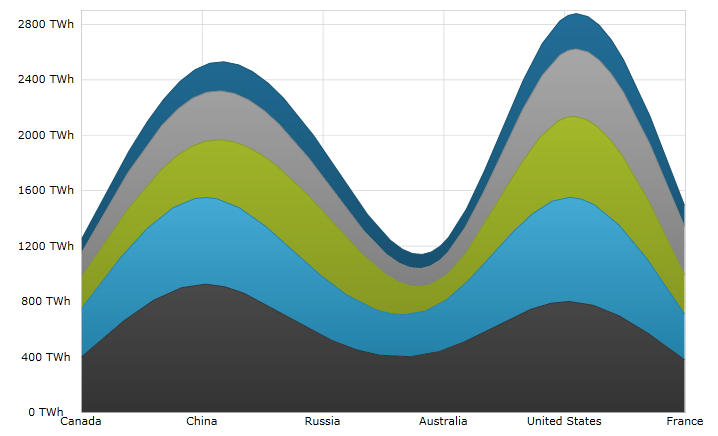
The Stacked 100-Spline Area Series is identical to the StackedSplineAreaSeries in all aspects except in their treatment of the values on y-axis. Instead of presenting a direct representation of the data, the Stacked100SplineAreaSeries presents the data in terms of percent of the sum of all values in a data point.
|
|
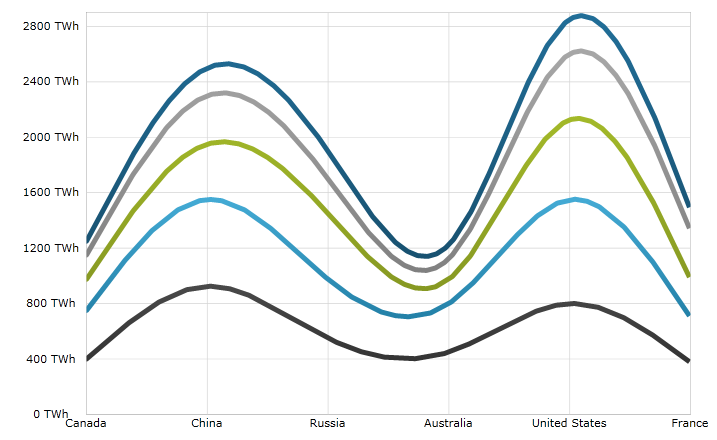
The Stacked100SplineSeries is identical to the StackedSplineSeries in all aspects except in their treatment of the values on y-axis. Instead of presenting a direct representation of the data, the Stacked100SplineSeries presents the data in terms of percent of the sum of all values in a data point.
|
|
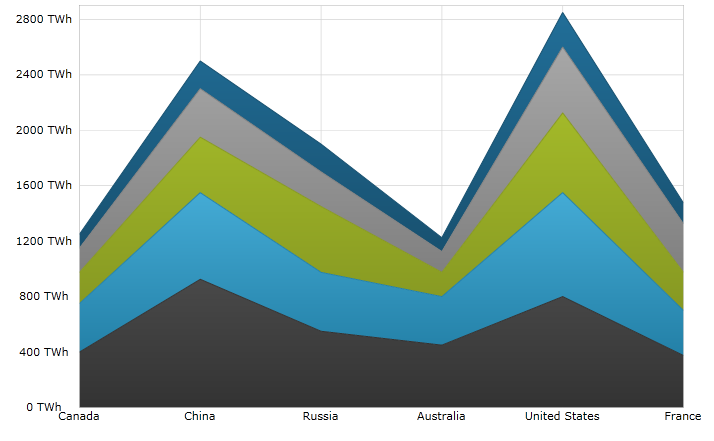
Stacked Area Series is rendered using a collection of points connected by line segments (StackedFragmentSeries) with the area below the line filled in and stacked on top of each other. Each stacked fragment in the collection represents one visual element in each stack. Each stack can contain both positive and negative values. All positive values are grouped on the positive side of the y-axis, and all negative values are grouped on the negative side of the y-axis.
|
|
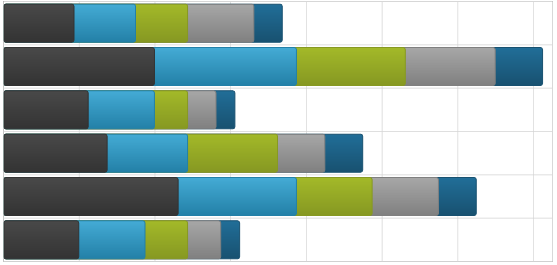
Displays discrete data in bars stacked next to each other. Categories are arranged vertically and values are stacked horizontally.
Used for showing the changes in a data series over time or for comparing multiple items.
|
|
Displays discrete data in columns stacked on top of each other. Categories are arranged horizontally and values are stacked vertically.
Used for showing the changes in a data series over time or for comparing multiple items.
|
|
Stacked Line Series is rendered using a collection of points connected by line segments (StackedFragmentSeries) that are stacked on top of each other. Each stacked fragment in the collection represents one visual element in each stack. Each stack can contain both positive and negative values. All positive values are grouped on the positive side of the y-axis, and all negative values are grouped on the negative side of the y-axis.
|
|
Stacked Spline Area Series is rendered using a collection of points connected by smooth curves of spline segments (StackedFragmentSeries) with the area below the spline filled in and stacked on top of each other. Each stacked fragment in the collection represents one visual element in each stack. Each stack can contain both positive and negative values. All positive values are grouped on the positive side of the y-axis, and all negative values are grouped on the negative side of the y-axis.
|
|
Stacked Spline Series is rendered using a collection of points connected by smooth curves of spline segments (StackedFragmentSeries) that are stacked on top of each other. Each stacked fragment in the collection represents one visual element in each stack. Each stack can contain both positive and negative values. All positive values are grouped on the positive side of the y-axis, and all negative values are grouped on the negative side of the y-axis.
|